Data Domain
Backup & Cyber Recovery
Field Guide
How to Upgrade Dell EMC Data Domain Operating System (DD OS): A Step-by-Step Guide
The complete Data Domain OS upgrade process — planning, validation, execution, and post-upgrade verification — for production appliances. Dell EMC Data Domain has been rebranded as Dell PowerProtect DD — the appliances are now sold as the PowerProtect DD series, while the operating system is still called DD OS. The platform and upgrade workflow are unchanged, and both names appear in Dell documentation and on the appliance. Examples reference the current DD OS 8.x line (the 8.6 family is Dell’s Long-Term Support release for 2026).
Dell EMC Data Domain appliances — now sold as Dell PowerProtect DD — are a cornerstone of modern data protection environments, providing enterprise-grade deduplication, backup storage, disaster recovery, and cyber resilience. Like any enterprise storage platform, keeping the Data Domain Operating System (DD OS) current is essential for security, performance, stability, and compatibility with backup applications such as Dell NetWorker, PowerProtect Data Manager, Commvault, Veeam, Veritas NetBackup, and IBM Spectrum Protect. This guide walks through the complete DD OS upgrade process end to end.
Why upgrade Data Domain OS?
Organizations should regularly upgrade DD OS to address security vulnerabilities, gain new features and enhancements, improve replication reliability, increase backup and restore performance, maintain vendor support compliance, ensure compatibility with backup software and hypervisors, and resolve known defects.
| Benefit | Impact |
|---|---|
| Security updates | Reduces cyber risk and closes published CVEs |
| Performance improvements | Faster backup and restore operations |
| Feature enhancements | New capabilities and integrations |
| Bug fixes | Improved stability |
| Vendor support | Maintains a supported configuration |
Pre-upgrade planning checklist
Before upgrading any production Data Domain appliance, complete the following validation steps. Connect to the system over SSH for each command.
1. Verify the current DD OS version
system show version

# example output
Data Domain OS 8.5.0.15
Document the current version, target version, appliance model, and serial number.
2. Review the Dell support compatibility matrix
Validate compatibility with backup software, replication partners, DD Boost clients, PowerProtect appliances, Cloud Tier integrations, and Retention Lock configurations. Read the target release notes carefully before proceeding, and confirm your current-to-target version path is supported — DD OS does not always allow a direct jump across multiple major versions.
3. Verify system health
alerts show current
filesys status
storage show all
Ensure there are no active hardware faults, the filesystem is healthy, there are no disk failures, and no unresolved alerts.
4. Confirm available capacity
filesys show space
Keep at least 10–20% free filesystem capacity, plus adequate space for temporary upgrade files.
5. Validate replication status
replication show summary
For replicated environments, confirm replication is healthy with no active failures and no lagging contexts.
6. Create a configuration backup
config backup create
Export the configuration and store the backup externally — it is your rollback reference.
Downloading the DD OS upgrade package
Download the approved DD OS package from Dell Support, verify its MD5/SHA checksum against the published hash, and read the release notes. Transfer the package to the appliance with SCP.
# typical filename
DDOS_8.7.1.0.pkg

# transfer to the appliance
scp DDOS_8.7.1.0.pkg sysadmin@dd01:/ddvar/releases/
Installing the DD OS upgrade
Step 1: Confirm the package is present
software show repository

# example
Package: DDOS_8.7.1.0.pkg
Status:  Available
Step 2: Run the precheck
software upgrade precheck
Review every warning and error. Common blockers are insufficient space, hardware faults, and an unsupported version path. Resolve all of them before proceeding.
Step 3: Start the upgrade
software upgrade start

# monitor progress
software upgrade status

# example
Upgrade Status: In Progress
Percent Complete: 45%
Step 4: System reboot
The appliance reboots during the upgrade. Downtime depends on appliance model, DD OS version, storage capacity, and hardware generation — a 15–60 minute outage is typical. High-availability (HA) systems experience significantly reduced disruption.
Post-upgrade validation
After the reboot completes, perform a full validation before returning the system to production.
# confirm the new version is active
system show version

# filesystem should report Running
filesys status

# verify services: CIFS, NFS, DD Boost, replication, Cloud Tier
system services status

# confirm replication contexts resume
replication show summary
Then verify backup connectivity end to end: run test backups and restores from Veeam, NetWorker, PowerProtect Data Manager, NetBackup, and Commvault, and confirm DD Boost connectivity is functional. A clean version string is not success — a completed backup and restore is.
Upgrading replication pairs in the right order
Replication compatibility runs destination-down: a newer destination can almost always receive from an older source, but not the reverse. Upgrade the destination first, validate, then upgrade the source.
Identify which system is the source and which is the destination
Before sequencing the upgrade, confirm the direction of every replication context. Run this on either appliance — it lists each context with its source and destination paths:
replication show config

# example
CTX  Source                              Destination
---  ----------------------------------  ----------------------------------
1    dir://dd-prod01.example.com/backup  dir://dd-dr01.example.com/backup
2    mtree://dd-prod01.example.com/...   mtree://dd-dr01.example.com/...
Read it from the perspective of the appliance you are logged in to: if this system’s hostname appears in the Destination column, it is the destination — upgrade it first. If it appears in the Source column, it is the source — upgrade it last. For per-context direction, state, and sync lag, add:
replication show detailed
Common upgrade issues
| Symptom | Likely cause | Resolution |
|---|---|---|
| Upgrade package not detected | Wrong location, permissions, or corrupt package | software show repository; re-verify checksum and re-transfer to /ddvar/releases/ |
| Insufficient space | Filesystem below the free-space threshold | filesys show space; clear unnecessary files and retry |
| Replication failure after upgrade | Network interruption, version mismatch, or certificate issue | replication show detailed; confirm pair order and certificates |
| DD Boost connection failures | Service state after reboot | ddboost show connections; restart with ddboost disable then ddboost enable |
Best practices for production upgrades
- Schedule maintenance windows. Always upgrade during an approved window with change-management sign-off.
- Test in non-production first. Validate backup jobs, replication, and disaster-recovery workflows on a non-production system before touching production.
- Upgrade replication pairs carefully. Destination first, validate, then source (see Figure 02).
- Retain rollback documentation. Record the previous version, the upgrade package, the configuration backup, and the change-management ticket.
Security considerations
Modern ransomware increasingly targets backup infrastructure, because an attacker who can corrupt or delete backups removes the victim’s ability to recover. Keeping DD OS current helps address security vulnerabilities, improves cyber-recovery readiness, strengthens Data Domain Retention Lock (including compliance mode), and maintains regulatory compliance. Treat DD OS upgrades as part of your broader cyber-resilience strategy, not just routine maintenance — Dell publishes security advisories (DSA bulletins) for Data Domain, and current DD OS is how you stay ahead of them.
Frequently asked questions
How long does a Data Domain OS upgrade take?
A typical DD OS upgrade outage is 15–60 minutes, depending on appliance model, the version jump, storage capacity, and hardware generation. High-availability (HA) systems see significantly reduced disruption because the upgrade is handled one node at a time.
Should I upgrade the source or destination first in a replication pair?
Upgrade the destination first, validate that replication is healthy, then upgrade the source. A newer destination can receive from an older source, but an older destination generally cannot receive from a newer source.
Can I skip DD OS versions during an upgrade?
Not always. DD OS enforces supported upgrade paths, and a direct jump across multiple major versions may not be allowed. Check the Dell compatibility matrix and target release notes, and stage through an intermediate version if the path requires it.
Does a DD OS upgrade cause downtime?
Yes — the appliance reboots during the upgrade, so a non-HA system is offline for the duration. Schedule the upgrade in a maintenance window and pause or reschedule backup jobs that overlap it. HA configurations minimize, but do not always eliminate, disruption.
How do I roll back a Data Domain OS upgrade?
DD OS does not offer a simple one-command downgrade; rollback is handled with Dell support using your configuration backup and documented prior version. This is why the pre-upgrade configuration backup and change record are mandatory, not optional.
Is Data Domain the same as PowerProtect DD?
Yes. Dell rebranded the Data Domain line as PowerProtect DD in 2019. The hardware, DD OS, and upgrade workflow are the same platform; you will see both names across Dell documentation and the appliance itself.
What DD OS version should I upgrade to?
Choose a target supported by your backup software, replication partners, and hardware per the Dell compatibility matrix. For stability, many enterprises track the current Long-Term Support family (the DD OS 8.6 line for 2026); feature releases run later. Always confirm against the matrix rather than simply taking the newest build.
How do I verify a DD OS upgrade succeeded?
Confirm the new version with system show version, verify the filesystem is Running, check services (CIFS, NFS, DD Boost, replication, Cloud Tier), confirm replication contexts resume, and run a real test backup and restore from your backup applications. A completed restore is the only true success signal.
Conclusion
Upgrading Dell EMC Data Domain (PowerProtect DD) OS is a straightforward process when proper planning and validation are performed. A structured approach — compatibility checks, health assessments, a configuration backup, careful replication-pair sequencing, and full post-upgrade validation — lets administrators minimize downtime and ship a successful upgrade. A well-maintained Data Domain environment delivers improved performance, stronger security, and greater reliability for enterprise backup and recovery. For teams that would rather not run it in-house, WUC Technologies offers managed backup and enterprise storage services that cover Data Domain upgrades end to end.
- Data Domain and DDVE: How to Upgrade the Data Domain Operating System — Dell support KB 000021710.
- PowerProtect DD: DD OS Software Versions and Download Links — Dell support KB 000081247.
- PowerProtect Data Domain: DDHA Upgrade Pre-Check — Dell support KB 000328991.
- Dell PowerProtect Data Domain Info Hub — core documentation and release notes. Dell.
WUC runs Data Domain upgrades under change control
WUC Technologies provides expert consulting for Dell EMC Data Domain and PowerProtect DD, backup modernization, cyber recovery, and enterprise storage platforms — compatibility validation, peer-reviewed upgrade runbooks, and post-upgrade verification on live backup estates.
NAS Networking
VLAN
Field Guide
How to Create a Broadcast Domain, VLAN, and NAS LIFs on NetApp ONTAP
A repeatable procedure to stand up a tagged NAS network on a NetApp ONTAP cluster: one broadcast domain, a VLAN across your interface groups, and four NAS data LIFs — first in System Manager, then the copy-paste CLI version. Every value here is an example (VLAN 100, subnet 10.10.20.64/27, SVM nas_svm01); swap in your own.
What you will build
- SVM:
nas_svm01 - Broadcast domain:
bd-vlan100-nas· IPspaceDefault· MTU1500 - VLAN ID:
100, on interface groupsa0aanda0bacross all nodes - Subnet:
10.10.20.64/27· four NAS LIFs at10.10.20.66–.69, one per node (cluster1-01…cluster1-04)
Prerequisites
- VLAN 100 is configured and allowed on every connected switch trunk.
- The SVM
nas_svm01already exists. - The interface groups
a0aanda0balready exist on each node. - You have a Cluster Admin account and the cluster management IP.
The next two sections build the same broadcast domain, VLAN, and NAS LIFs by two different methods. Part 1 uses the ONTAP System Manager GUI; Part 2 is the equivalent copy-paste CLI. Use whichever fits your workflow — you do not need both.
Part 1 — Method A: System Manager (GUI)
Step 1: Create the broadcast domain
Go to Network > Overview > Broadcast Domains and click Add. Name it bd-vlan100-nas, set IPspace to Default and MTU to 1500, and save it without selecting ports — the VLAN ports get added after they exist.
Step 2: Create the VLAN
Go to Network > Ethernet Ports and click + VLAN. Enter VLAN ID 100 and create it on a0a and a0b on every node (cluster1-01 through cluster1-04). Confirm each new VLAN port lands in the bd-vlan100-nas broadcast domain.
Step 3: Create the NAS LIFs
Go to Network > Overview > Network Interfaces and click Add. Create four data LIFs for nas_svm01 using 10.10.20.66, .67, .68, and .69 — assign each LIF to its node and a VLAN-100 port.
Step 4: Verify
Back in Network > Network Interfaces, confirm all four LIFs show Up/Up and Home = True.
Part 2 — Method B: CLI
This is the command-line equivalent of Part 1 — the identical broadcast domain, VLAN, and NAS LIFs, built from the cluster shell instead of System Manager. Run this instead of Part 1, not after it.
1. Create the broadcast domain
network port broadcast-domain create -broadcast-domain bd-vlan100-nas -ipspace Default -mtu 1500

# verify
network port broadcast-domain show -broadcast-domain bd-vlan100-nas
2. Create VLAN 100 on each node and interface group
network port vlan create -node cluster1-01 -port a0a -vlan-id 100
network port vlan create -node cluster1-01 -port a0b -vlan-id 100
network port vlan create -node cluster1-02 -port a0a -vlan-id 100
network port vlan create -node cluster1-02 -port a0b -vlan-id 100
network port vlan create -node cluster1-03 -port a0a -vlan-id 100
network port vlan create -node cluster1-03 -port a0b -vlan-id 100
network port vlan create -node cluster1-04 -port a0a -vlan-id 100
network port vlan create -node cluster1-04 -port a0b -vlan-id 100

# verify
network port vlan show -vlan-id 100
3. Add the VLAN ports to the broadcast domain
network port broadcast-domain add-ports -broadcast-domain bd-vlan100-nas -ports cluster1-01:a0a-100,cluster1-01:a0b-100,cluster1-02:a0a-100,cluster1-02:a0b-100,cluster1-03:a0a-100,cluster1-03:a0b-100,cluster1-04:a0a-100,cluster1-04:a0b-100

# verify
network port broadcast-domain show-ports -broadcast-domain bd-vlan100-nas
4. Create the NAS data LIFs
network interface create -vserver nas_svm01 -lif lif_nas_svm01_100_01 -service-policy default-data-files -home-node cluster1-01 -home-port a0b-100 -address 10.10.20.66 -netmask-length 27
network interface create -vserver nas_svm01 -lif lif_nas_svm01_100_02 -service-policy default-data-files -home-node cluster1-02 -home-port a0b-100 -address 10.10.20.67 -netmask-length 27
network interface create -vserver nas_svm01 -lif lif_nas_svm01_100_03 -service-policy default-data-files -home-node cluster1-03 -home-port a0b-100 -address 10.10.20.68 -netmask-length 27
network interface create -vserver nas_svm01 -lif lif_nas_svm01_100_04 -service-policy default-data-files -home-node cluster1-04 -home-port a0a-100 -address 10.10.20.69 -netmask-length 27
5. Verify LIF status
network interface show -vserver nas_svm01 -fields address,home-node,home-port,status-admin,status-oper,is-home
Validation checklist
- Broadcast domain
bd-vlan100-nascreated (MTU 1500, IPspace Default). - VLAN 100 created on
a0aanda0bon all four nodes. - All eight VLAN ports added to the broadcast domain.
- Four NAS LIFs created for
nas_svm01. - All LIFs report Up/Up and Home = True.
- Connectivity validated from a NAS client on VLAN 100.
ONTAP network architecture: ports, VLANs, broadcast domains, and LIFs
Before the commands, hold the mental model. In ONTAP networking, a physical port carries one or more tagged VLANs; each VLAN port joins exactly one broadcast domain; that broadcast domain seeds a failover group; and a data LIF rides on a port inside the domain, failing over only to ports the failover group says are reachable. Get the layering right and LIF failover behaves predictably; get it wrong and a LIF comes up offline or a broadcast domain partitions. The three diagrams below are the reference picture for the rest of this guide.
What the administrator is seeing: a single trunk feeding two logically isolated networks. Because each VLAN port belongs to its own broadcast domain, a reachability problem on the NFS network never drags CIFS LIFs down with it. That isolation is the practical payoff of broadcast domains, and it is why ONTAP networking best practices favor one broadcast domain per Layer 2 network rather than one giant shared domain.
bd-nfs-120, nfs_lif01 survives a takeover of cluster1-01 by moving to cluster1-02. Omit one node’s ports and that node becomes a failover dead end.
Complete ONTAP broadcast domain deployment example
This is the full end-to-end ONTAP VLAN configuration for a new NFS network on VLAN 120, from VLAN creation through a verified data LIF. Run it from the cluster shell as a Cluster Admin. Sample output is shown so you know what a healthy result looks like at each step; substitute your own node names, ports, and addresses (the values below use documentation-range IPs).
1. Create the VLAN ports
Tag VLAN 120 onto each node’s physical data ports. The VLAN port name is <port>-<vlan-id>.
network port vlan create -node cluster1-01 -port e0c -vlan-id 120
network port vlan create -node cluster1-01 -port e0d -vlan-id 120
network port vlan create -node cluster1-02 -port e0c -vlan-id 120
network port vlan create -node cluster1-02 -port e0d -vlan-id 120
2. Verify the VLAN ports
network port vlan show -vlan-id 120

         Network       Network
Node     VLAN Name     Port    VLAN ID  MAC Address
-------- ------------- ------- -------- -----------------
cluster1-01
         e0c-120       e0c     120      90:e2:ba:11:22:01
         e0d-120       e0d     120      90:e2:ba:11:22:02
cluster1-02
         e0c-120       e0c     120      90:e2:ba:33:44:01
         e0d-120       e0d     120      90:e2:ba:33:44:02
4 entries were displayed.
3. Create the broadcast domain
Create bd-nfs-120 in the Default IPspace with the MTU your switch trunk is configured for. Use 9000 only if jumbo frames are enabled end to end; otherwise 1500.
network port broadcast-domain create -broadcast-domain bd-nfs-120 -mtu 9000 -ipspace Default
4. Add the VLAN ports to the broadcast domain
network port broadcast-domain add-ports -broadcast-domain bd-nfs-120 -ports cluster1-01:e0c-120,cluster1-01:e0d-120,cluster1-02:e0c-120,cluster1-02:e0d-120
5. Verify reachability
On ONTAP 9.8 and later, network port reachability show tells you whether each port actually reaches the broadcast domain ONTAP expects. ok is the only state you want; anything else is covered in the troubleshooting section below.
network port reachability show -detail -node cluster1-01 -port e0c-120

                      Reachable
Node    Port      Status        Broadcast Domains
------- --------- ------------- -----------------
cluster1-01
        e0c-120   ok            bd-nfs-120
  Expected Broadcast Domain: bd-nfs-120
  Reachable Broadcast Domains: bd-nfs-120
6. (Optional) Create a dedicated IPspace for multi-tenant isolation
If this network belongs to an isolated tenant rather than the shared Default IPspace, create the IPspace first and build the broadcast domain inside it. Most single-tenant clusters skip this and stay in Default.
network ipspace create -ipspace ips-tenant-a
network port broadcast-domain create -broadcast-domain bd-nfs-120 -mtu 9000 -ipspace ips-tenant-a
7. Create the NFS data LIF
Create the LIF on a VLAN 120 port inside the broadcast domain. ONTAP assigns its failover group from the broadcast domain automatically.
network interface create -vserver nas_svm01 -lif nfs_lif01 -service-policy default-data-files -home-node cluster1-01 -home-port e0c-120 -address 10.10.20.130 -netmask-length 24
8. Verify the configuration
network interface show -vserver nas_svm01 -lif nfs_lif01

            Logical    Status     Network          Current   Current Is
Vserver     Interface  Admin/Oper Address/Mask     Node      Port    Home
----------- ---------- ---------- ---------------- --------- ------- ----
nas_svm01
            nfs_lif01  up/up      10.10.20.130/24   cluster1-01 e0c-120 true
up/up with Is Home = true is the finish line: the LIF is administratively up, operationally up, and sitting on its home port. If you see up/down, jump to the troubleshooting section — it is almost always a broadcast domain or reachability problem, not the LIF itself.
Broadcast domain vs VLAN vs IPspace
These three constructs get conflated constantly, and the confusion is the root of most ONTAP networking design mistakes. They operate at different layers and solve different problems. A VLAN is Layer 2 segmentation on the wire. A broadcast domain is ONTAP’s reachability-and-failover grouping of ports. An IPspace is a multi-tenant isolation boundary that lets the same IP subnet exist twice in one cluster without collision.
| VLAN | Broadcast domain | IPspace | |
|---|---|---|---|
| Definition | A tagged Layer 2 segment (802.1Q) on a physical port | A group of ports with the same Layer 2 reachability and MTU | A distinct, isolated network namespace within the cluster |
| Layer | Layer 2 | ONTAP construct over Layer 2 | Layer 3 isolation |
| Purpose | Separate traffic on shared physical links | Define where a LIF may live and fail over | Let overlapping subnets coexist for multiple tenants |
| Scope | Per physical port | Cluster-wide, spans nodes | Cluster-wide, contains broadcast domains |
| Isolation level | Traffic separation only | Failover boundary | Full address-space isolation |
| Typical use | NFS on VLAN 120, CIFS on VLAN 20 | One per Layer 2 network, per MTU | Service-provider or strict multi-tenant clusters |
Real-world example. A service provider hosts two customers who both use 10.0.0.0/24 for NAS. In a single IPspace that is an immediate address collision. The fix: one IPspace per customer (ips-tenant-a, ips-tenant-b), each containing its own broadcast domain built on its own VLAN. The VLAN keeps the traffic apart on the wire, the broadcast domain governs failover within each tenant, and the IPspace lets the identical subnet exist twice without conflict. On the SAN side the equivalent isolation discipline is single-initiator zoning — see our Cisco MDS zoning field guide for the Fibre Channel counterpart.
ONTAP version considerations
Broadcast domain and VLAN behavior changed materially across recent ONTAP releases. If you administer a fleet at mixed versions — or you are planning a cluster upgrade — the differences below determine whether ONTAP creates broadcast domains for you, whether it will second-guess a manual choice, and how it surfaces unhealthy ports.
| ONTAP version | Broadcast domain / VLAN behavior | What it means for you |
|---|---|---|
| 9.7 and earlier | Fully manual. You create every broadcast domain and add ports by hand; no reachability engine. | Nothing is inferred — a missing port stays missing until you notice it. Document configs carefully. |
| 9.8 – 9.11 | Reachability-based networking. ONTAP auto-creates broadcast domains from detected Layer 2 reachability; network port reachability show and repair arrive. |
Let ONTAP repair misconfigured ports rather than hand-editing. Trust the reachability scan as source of truth. |
| 9.12 – 9.13 | System Manager lets you manually add a broadcast domain and manually select one when creating a LIF, alongside the automatic choice. | You regain manual control in the GUI — but a manual broadcast-domain pick triggers a connectivity-loss warning. Heed it. |
| 9.14 and later | Unused untagged ports with no native-VLAN reachability are flagged degraded, making dead ports visible at a glance. | Current best practice: clean up or repurpose degraded ports rather than leaving them to mask real failures. |
Why upgraders should care: a cluster moving from 9.7 to 9.8+ shifts from “ONTAP does exactly what you typed” to “ONTAP actively reconciles ports against detected reachability.” Administrators who do not expect that can be surprised when the reachability scan reassigns a port. The behavior is correct and desirable — but it rewards understanding the model rather than fighting it.
Troubleshooting ONTAP broadcast domains and VLANs
Five failure modes account for the overwhelming majority of broadcast domain and LIF failover tickets. Each one below has a concrete diagnosis path and fix. The quick-reference table follows.
Problem 1: LIF remains offline (up/down) after creation
A freshly created LIF that reports up/down is almost never a LIF fault. The usual causes are a VLAN port that was never added to the broadcast domain, an address in the wrong subnet, or a failover target that does not exist. Confirm the home port is actually in the domain, then verify the subnet matches the VLAN gateway.
network port broadcast-domain show -broadcast-domain bd-nfs-120
network interface show -lif nfs_lif01 -fields home-port,failover-group,subnet-name
Problem 2: Broadcast domain partitioned
A partitioned broadcast domain means its ports no longer all share Layer 2 reachability — some ports can reach each other and some cannot, so failover across the partition silently breaks. The reachability scan is the authoritative diagnosis.
network port reachability show -detail

# a partition shows as "misconfigured-reachability" or split reachable domains
# repair the affected port back to its correct domain:
network port reachability repair -node cluster1-02 -port e0d-120
A misconfigured-reachability status means the port has reachability to a broadcast domain other than the one it is configured for — usually a switch-side VLAN or trunk change. repair reassigns the port to the domain ONTAP actually detects.
Problem 3: Port not reachable
A port reporting no-reachability is a wire-or-switch problem, not an ONTAP one. Work outward: confirm the switch trunk allows the VLAN, confirm tagging matches (a port expecting tagged frames on an access port sees nothing), and confirm MTU agreement — a jumbo-frame broadcast domain on a 1500-MTU switch path produces exactly this symptom.
network port show -node cluster1-01 -port e0c-120 -fields mtu,link-status
network port reachability show -node cluster1-01 -port e0c-120
Problem 4: Node ports missing from the broadcast domain
If only one node’s ports are in the domain, LIFs on the other node cannot fail over to it — the classic “works until takeover” outage. List the domain’s ports and add any node that is missing.
network port broadcast-domain show -broadcast-domain bd-nfs-120 -instance
network port broadcast-domain add-ports -broadcast-domain bd-nfs-120 -ports cluster1-02:e0c-120,cluster1-02:e0d-120
Problem 5: Failover group not populated correctly
ONTAP builds the failover group from the broadcast domain’s ports. If a LIF’s failover targets look wrong, the fault is upstream in the broadcast domain membership. Verify the group, then confirm the LIF references it.
network interface failover-groups show -failover-group bd-nfs-120
network interface show -lif nfs_lif01 -fields failover-group,failover-policy
| Symptom | Root cause | Resolution |
|---|---|---|
| LIF stays up/down after creation | Home port not in the broadcast domain, or wrong subnet | Add the VLAN port to the domain; confirm address/mask matches the VLAN gateway |
| Failover fails only during takeover | Partner node’s ports missing from the domain | add-ports for the partner node; re-check failover group |
| Reachability shows misconfigured | Switch VLAN/trunk change moved the port’s real reachability | network port reachability repair on the port |
| Port shows no-reachability | Trunk doesn’t allow the VLAN, tagging mismatch, or MTU mismatch | Fix switch trunk/VLAN allow-list; align MTU end to end |
| Failover group has too few targets | Broadcast domain under-populated upstream | Correct domain membership; the group repopulates automatically |
For production clusters carrying live NAS workloads, these changes belong under change control with a reviewed rollback. That is the work WUC’s managed storage and data-center networking services handle day to day.
Creating broadcast domains in ONTAP System Manager
The CLI walkthrough above is the fastest path for engineers who live in the cluster shell. For teams who standardize on the GUI, here is the same NFS-on-VLAN-120 deployment in ONTAP System Manager, with the result you should expect to see after each step. The navigation path is the same on every modern ONTAP release; the one screen newer administrators miss is the reachability check between creating the VLAN and creating the LIF.
Step-by-step, with expected results
- Network > Overview. Confirm the physical ports (
e0c,e0d) show up. Expected: both ports green, no existing VLAN 120. - Ethernet Ports > + VLAN. Create VLAN ID 120 on
e0cande0dfor each node. Expected: new portse0c-120ande0d-120appear. - Verify port reachability. On ONTAP 9.8+, the port detail shows its reachable broadcast domain. Expected: reachability
ok; if it reads no-reachability, fix the switch trunk before continuing. - Broadcast Domains > Add. Create
bd-nfs-120with the correct MTU and IPspace. Expected: the VLAN 120 ports are listed as members. - Network Interfaces > Add. Create
nfs_lif01fornas_svm01on a VLAN 120 port. From ONTAP 9.12, System Manager shows the auto-selected broadcast domain — override only with cause. Expected: LIF statusup/up. - Test connectivity. Mount the export from a client on VLAN 120. Expected: successful mount and read/write; the LIF stays on its home port.
IPspace isolation for multi-tenant clusters
When a single cluster serves tenants who must never see one another’s traffic — or who use overlapping IP ranges — the broadcast domain alone is not enough. IPspaces give each tenant a private network namespace: its own broadcast domains, VLANs, and LIFs, with full address-space isolation. The same subnet can exist in two IPspaces without collision.
10.0.0.10/24. In one IPspace that is a fatal collision; across two IPspaces it is routine. This is the construct that makes secure multi-tenancy possible on shared ONTAP hardware.
Real-world ONTAP networking deployment examples
Patterns beat theory. Four deployments below show how broadcast domain, VLAN, and IPspace design changes with the workload and the resilience requirement.
Example 1: healthcare — CIFS for clinical systems, NFS for VMware
A hospital runs clinical applications over CIFS and a VMware estate over NFS, on one ONTAP cluster, with strict separation and high availability. Design: two VLANs (CIFS on VLAN 20, NFS on VLAN 120), two broadcast domains spanning the HA pair, and one data LIF per node per network. The CIFS and NFS domains stay independent so a reachability problem on the clinical network cannot affect the VMware datastores, and every LIF has a same-domain partner port to survive a controller takeover. Both networks live in the Default IPspace because there is a single tenant. The decision that matters: separate broadcast domains per Layer 2 network, not a shared domain, so failure domains stay small.
Example 2: VMware NFS datastore network
For NFS datastores, redundancy and frame sizing dominate. Design: a dedicated NFS VLAN, a broadcast domain at MTU 9000 (jumbo frames end to end — verified on the switch), and at least one NAS LIF per node so vSphere always has a local path. Best practice is to keep the datastore network on its own broadcast domain so its MTU and failover behavior are independent of every other workload, and to confirm reachability at MTU 9000 before mounting — a silent 9000-on-a-1500-path mismatch is the classic cause of datastores that mount but stall under load.
Example 3: multi-tenant service provider
A provider hosts many customers on shared hardware, several of whom use overlapping IP ranges. Design: one SVM and one IPspace per tenant, each IPspace containing its own broadcast domain and VLAN (see Figure 06). The IPspace boundary delivers full address-space isolation, so two tenants can both use 10.0.0.0/24 without conflict; the per-tenant VLAN keeps traffic separated on the wire; the per-tenant broadcast domain governs failover inside each tenant. This is the only design that safely supports overlapping subnets on one cluster.
Example 4: MetroCluster across two sites
In a MetroCluster, networking must survive a whole-site loss. Design considerations: broadcast domains and their VLANs must exist identically at both sites, with the same names and MTU, so a LIF can come up at the surviving site after a switchover. Layer 2 reachability for each VLAN has to be present at both locations — the most common MetroCluster networking defect is a VLAN that is trunked at site A but missing at site B, which works perfectly until the day you actually fail over. Validate reachability at both sites, and rehearse a switchover in a maintenance window rather than discovering the gap during a real event.
Automating broadcast domain and LIF deployment
At fleet scale you do not click through System Manager forty times — you codify the build. All three approaches below create the same VLAN 120 / bd-nfs-120 / nfs_lif01 stack. Keep credentials out of source: use environment variables or a vault, never hard-coded secrets, and validate TLS against the cluster certificate in production.
ONTAP REST API
The ONTAP REST API is the modern programmatic interface. Authenticate with HTTP Basic over HTTPS against the cluster management LIF, then POST each object.
# 1. Create the VLAN port (e0c-120 on cluster1-01)
curl -sk -u "$ONTAP_USER:$ONTAP_PASS" -X POST \
  https://10.10.20.10/api/network/ethernet/ports \
  -H "Content-Type: application/json" \
  -d '{"type":"vlan","node":{"name":"cluster1-01"},"vlan":{"base_port":{"name":"e0c","node":{"name":"cluster1-01"}},"tag":120}}'

# 2. Create the broadcast domain
curl -sk -u "$ONTAP_USER:$ONTAP_PASS" -X POST \
  https://10.10.20.10/api/network/ethernet/broadcast-domains \
  -H "Content-Type: application/json" \
  -d '{"name":"bd-nfs-120","mtu":9000,"ipspace":{"name":"Default"}}'

# 3. Create the NAS data LIF
curl -sk -u "$ONTAP_USER:$ONTAP_PASS" -X POST \
  https://10.10.20.10/api/network/ip/interfaces \
  -H "Content-Type: application/json" \
  -d '{"name":"nfs_lif01","svm":{"name":"nas_svm01"},"ip":{"address":"10.10.20.130","netmask":"24"},"location":{"home_node":{"name":"cluster1-01"},"home_port":{"name":"e0c-120","node":{"name":"cluster1-01"}}},"service_policy":{"name":"default-data-files"}}'

# Typical response: HTTP 201 Created with a job reference, e.g.
# {"job":{"uuid":"f1a2...","_links":{"self":{"href":"/api/cluster/jobs/f1a2..."}}}}
The -k flag skips certificate validation for lab use only; in production drop -k and trust the cluster CA.
Python (requests)
import os
import requests

CLUSTER = "10.10.20.10"
AUTH = (os.environ["ONTAP_USER"], os.environ["ONTAP_PASS"])
BASE = f"https://{CLUSTER}/api"

session = requests.Session()
session.auth = AUTH
session.verify = "/etc/ssl/ontap-ca.pem"   # trust the cluster CA in prod

def post(path, payload):
    r = session.post(f"{BASE}{path}", json=payload, timeout=30)
    r.raise_for_status()
    return r.json()

post("/network/ethernet/ports", {
    "type": "vlan",
    "node": {"name": "cluster1-01"},
    "vlan": {"base_port": {"name": "e0c", "node": {"name": "cluster1-01"}}, "tag": 120},
})

post("/network/ethernet/broadcast-domains", {
    "name": "bd-nfs-120", "mtu": 9000, "ipspace": {"name": "Default"},
})

post("/network/ip/interfaces", {
    "name": "nfs_lif01",
    "svm": {"name": "nas_svm01"},
    "ip": {"address": "10.10.20.130", "netmask": "24"},
    "location": {
        "home_node": {"name": "cluster1-01"},
        "home_port": {"name": "e0c-120", "node": {"name": "cluster1-01"}},
    },
    "service_policy": {"name": "default-data-files"},
})

print("VLAN, broadcast domain, and NAS LIF created.")
Ansible (netapp.ontap collection)
Ansible is the cleanest choice for repeatable, idempotent fleet deployments. Store credentials in Ansible Vault, never in plain inventory.
# inventory.yml
all:
  hosts:
    cluster1:
      ansible_host: 10.10.20.10
      netapp_username: "{{ vault_ontap_user }}"
      netapp_password: "{{ vault_ontap_pass }}"

# deploy-nfs-net.yml
- name: Deploy VLAN 120 NFS networking
  hosts: cluster1
  gather_facts: false
  collections: [netapp.ontap]
  vars:
    login: &login
      hostname: "{{ ansible_host }}"
      username: "{{ netapp_username }}"
      password: "{{ netapp_password }}"
      https: true
      validate_certs: true
  tasks:
    - name: Create VLAN 120 on e0c
      na_ontap_net_vlan:
        state: present
        node: cluster1-01
        parent_interface: e0c
        vlanid: 120
        <<: *login

    - name: Create broadcast domain bd-nfs-120
      na_ontap_broadcast_domain:
        state: present
        name: bd-nfs-120
        mtu: 9000
        ipspace: Default
        ports: ["cluster1-01:e0c-120","cluster1-01:e0d-120"]
        <<: *login

    - name: Create NAS data LIF
      na_ontap_interface:
        state: present
        interface_name: nfs_lif01
        vserver: nas_svm01
        home_node: cluster1-01
        home_port: e0c-120
        address: 10.10.20.130
        netmask_length: 24
        service_policy: default-data-files
        <<: *login
# execute
ansible-playbook -i inventory.yml deploy-nfs-net.yml --ask-vault-pass
Because each module is declarative, re-running the playbook is safe: ports and domains that already exist are left untouched. That idempotence is the whole point of automating ONTAP networking — the same playbook builds a new cluster and audits an existing one.
ONTAP networking object quick-reference matrix
One table to keep the five objects straight — what each one is for, where it sits, and whether a NAS LIF depends on it.
| Object | Purpose | OSI layer | Traffic isolation | Admin scope | Needed for NAS LIF? | Typical use |
|---|---|---|---|---|---|---|
| VLAN | Tag/segment a link | Layer 2 | On the wire | Per port | Usually (tagged NAS) | NFS vs CIFS separation |
| Broadcast domain | Group reachable ports | Over Layer 2 | Failover domain | Cluster-wide | Yes | One per L2 network + MTU |
| Failover group | List LIF target ports | ONTAP construct | Failover only | Derived from domain | Yes (auto) | HA failover targeting |
| IPspace | Isolate a namespace | Layer 3 | Full address space | Cluster-wide | No (Default is fine) | Multi-tenant isolation |
| NAS LIF | Serve data on an IP | Layer 3 endpoint | N/A (consumer) | Per SVM | It is the LIF | NFS/CIFS client access |
Field notes from production ONTAP deployments
WUC’s storage engineering practice designs, deploys, and operates NetApp ONTAP networking for enterprise and regulated environments — healthcare, financial services, and multi-site infrastructure — across single clusters and MetroCluster. The guidance in this article is what the practice applies on production clusters carrying live NAS workloads, distilled into the lessons that repeat across engagements:
- MTU mismatches fail silently. A jumbo-frame broadcast domain on a 1500-MTU switch path mounts fine and then stalls under load. Verify MTU end to end before you trust the network, not after a user complains.
- Add the partner node’s ports before you test failover. The “works until takeover” outage is almost always a broadcast domain missing one node’s VLAN ports. Confirm both controllers are in the domain, then rehearse a takeover in a window.
- Trust the reachability engine on 9.8+. When a port reads misconfigured-reachability, the switch changed — let
network port reachability repairreconcile it rather than hand-editing membership. - Document the VLAN-to-broadcast-domain map. The single most useful artifact in an incident is a current table of which VLAN maps to which broadcast domain on which ports. Keep it with the runbook.
- MetroCluster gaps hide until switchover. A VLAN trunked at one site but not the other is invisible in steady state. Validate Layer 2 reachability at both sites, every time.
ONTAP NAS networking deployment checklist
A printable field checklist for a broadcast domain, VLAN, and NAS LIF build. Run it top to bottom; do not create the LIF until reachability is confirmed.
☐ Trunk allows the VLANs on every switch
☐ Tagging mode confirmed (tagged, not access)
☐ MTU matches the switch path end to end
☐ Both HA nodes’ ports included
☐ Per-tenant IPspace for overlapping subnets
☐ Domain created in the correct IPspace
☐ Address/mask matches the VLAN gateway
☐ Correct service policy applied
reachability show reads ok on every port☐ Failover group fully populated
☐ Takeover rehearsed in a maintenance window
☐ LIF inventory captured
☐ Runbook and rollback noted
Frequently asked questions
What is a broadcast domain in ONTAP?
A broadcast domain is a group of network ports across the cluster that share the same Layer 2 reachability and MTU. It defines where a LIF is allowed to live and where it may fail over, and it is the object from which ONTAP derives failover groups.
Can multiple VLANs exist in the same broadcast domain?
No. A broadcast domain represents one Layer 2 network, so its ports should all carry the same VLAN. Mixing VLANs in one broadcast domain breaks the reachability model and is a misconfiguration ONTAP will flag.
What happens if a port is not reachable?
A port with no reachability cannot carry LIF traffic and is excluded from effective failover. On ONTAP 9.8 and later, network port reachability show reports the status; the cause is almost always a switch trunk, VLAN tagging, or MTU mismatch rather than ONTAP itself.
Does ONTAP automatically create broadcast domains?
On ONTAP 9.8 and later, yes — ONTAP auto-creates broadcast domains based on detected Layer 2 reachability. On 9.7 and earlier you create them manually. From 9.12, System Manager also lets you add or select one by hand, with a connectivity-loss warning if you override the automatic choice.
What is the difference between a failover group and a broadcast domain?
A broadcast domain is the set of reachable ports; a failover group is the list of those ports a specific LIF may move to. ONTAP generates the failover group from the broadcast domain automatically, so the broadcast domain is the cause and the failover group is the effect.
Can a broadcast domain span nodes?
Yes, and for failover it must. A LIF can only fail over to a port in its broadcast domain, so a domain used for HA must contain ports from every node the LIF should survive onto — typically both controllers in an HA pair.
How do I verify VLAN connectivity?
Use network port vlan show to confirm the VLAN port exists, then network port reachability show to confirm it reaches the expected broadcast domain. A LIF reading up/up with Is Home = true is the final confirmation that the data path works.
What is an IPspace?
An IPspace is an isolated network namespace within a cluster. It lets the same IP subnet exist more than once without collision, which is what makes secure multi-tenancy possible. Broadcast domains live inside an IPspace; most single-tenant clusters use only the Default IPspace.
When should I create separate broadcast domains?
Create a separate broadcast domain per Layer 2 network and per MTU. NFS on VLAN 120 at MTU 9000 and CIFS on VLAN 20 at MTU 1500 belong in different domains so their failover and frame sizing stay independent.
How does System Manager handle broadcast domains?
From ONTAP 9.12, System Manager presents the automatically detected broadcast domain when you create a LIF and lets you override it manually. Choosing a domain by hand raises a warning about possible connectivity loss, because the automatic choice reflects actual reachability.
- Create a broadcast domain — NetApp ONTAP networking management. NetApp.
- Configure VLANs over physical ports — NetApp ONTAP networking management. NetApp.
- Create LIFs (network interfaces) — NetApp ONTAP networking management. NetApp.
- network interface create — ONTAP command reference. NetApp.
- Repair port reachability — NetApp ONTAP networking. NetApp.
- Create broadcast domains (ONTAP 9.8 and later) — NetApp ONTAP networking. NetApp.
WUC stands up NAS networking for you
Broadcast-domain design, peer-reviewed CLI, LIF placement for failover, and validation — on production ONTAP clusters carrying live NAS workloads.
NetApp ONTAP Ansible Playbook Reference: Enterprise Automation Examples
This is a working reference for automating NetApp ONTAP with the netapp.ontap Ansible collection — fourteen worked examples covering the jobs a storage engineer actually does, from creating an SVM to replicating a volume across clusters. It is the companion to our three Ansible field guides: installing the control node, the seven core playbooks, and securing credentials with Ansible Vault. Where those teach concepts, this one is the lookup table: find the job, copy the playbook.
Every entry shows the same playbook two ways. The amber block is the lab original — exactly as it runs in a NetApp training workshop, quirks and all. The blue block is the WUC-cleaned version — the same result rewritten for production: credentials via module_defaults pulling from a vault-encrypted global.vars, REST-native parameters, fully-qualified module names, and least-privilege defaults. The blue block has a copy button; the amber one does not. A short terminal run follows, then a note on exactly what changed between the two versions and why. Every playbook here validates as parseable YAML.
Modules current as of the netapp.ontap collection 23.x against ONTAP 9.12+ over REST. Variable names (PRI_CLU, PRI_SVM, …) come from the shared global.vars file documented in the Vault walkthrough.
How Ansible automates ONTAP: the REST architecture
Modern ONTAP automation should use REST-based workflows. This guide focuses exclusively on supported ONTAP REST API automation through the NetApp Ansible Collection (netapp.ontap) — every example here drives the ONTAP REST API, and every cleaned playbook sets use_rest: always so there is no ambiguity about which interface runs.
The mechanics are worth understanding before the examples, because they explain why these playbooks are safe to run against production. Ansible is agentless: nothing is installed on the ONTAP cluster. The netapp.ontap modules execute on an Ansible control node and make authenticated HTTPS calls to the cluster management LIF’s REST endpoint (/api/...). Each module is a thin, idempotent wrapper around a set of REST calls: it first reads current state with a GET, compares it to the state your playbook declares, and issues a POST or PATCH only if reality differs. That read-compare-act cycle is the whole engine.
Figure 01 · Ansible control node to ONTAP cluster over REST
Idempotency and desired-state: why these playbooks are safe to re-run
Two properties make Ansible suitable for production storage, and both follow directly from the read-compare-act cycle above. Idempotency means running a playbook twice produces the same result as running it once: the first run creates what is missing and reports changed; the second run finds reality already matching the declaration and reports changed=0, touching nothing. Desired-state management is the consequence — your playbook is not a script of imperative commands (“create this, then that”) but a description of how the cluster should look, and Ansible’s job is to make reality match that description regardless of the starting point.
The operational payoff is real. A changed=0 run is a free compliance audit: schedule any of these playbooks nightly, and a run that suddenly reports changed=1 is drift detected and already corrected — someone resized a volume by hand, and the next scheduled run quietly put it back and logged that it did. This is why every cleaned playbook in this reference uses state: present and task names that begin with “Ensure”: you are declaring desired state, not issuing commands, and the cluster gains a standing enforcement mechanism no hand-run CLI procedure can match.
Module quick-reference table
The netapp.ontap collection ships well over a hundred modules. These are the ones that carry most production automation — the working set behind every example in this guide and the day-2 operations around them.
| Module | Task | Typical production use case |
|---|---|---|
na_ontap_svm |
Create / manage a storage VM | Onboard a tenant, department, or customer; declare which protocols it may serve |
na_ontap_aggregate |
Create / manage an aggregate | Provision the physical capacity pool that volumes are carved from |
na_ontap_volume |
Create / resize / manage a volume | The unit of capacity for NAS shares, SAN LUNs, and S3 buckets; bulk volume provisioning |
na_ontap_interface |
Create / manage a LIF | Management, NAS data, and block data interfaces; one module, role set by service policy |
na_ontap_broadcast_domain |
Manage a broadcast domain | Group ports into a failover-capable Layer-2 domain before placing LIFs |
na_ontap_vlan |
Create / manage a VLAN interface | Tagged network segmentation for multi-tenant or multi-subnet data traffic |
na_ontap_cifs |
Publish / manage an SMB share | Expose a path as a Windows file share after the CIFS server is joined to AD |
na_ontap_export_policy |
Manage an NFS export policy | The named rule set that decides which client networks may mount an NFS volume |
na_ontap_snapshot_policy |
Manage a snapshot schedule policy | Standardize local data protection — hourly/daily/weekly retention — across volumes |
na_ontap_snapshot |
Take / manage an individual snapshot | Application-consistent point-in-time copies, e.g. before a change window or upgrade |
na_ontap_snapmirror |
Manage a SnapMirror relationship | Cross-cluster replication for disaster recovery and migration; orchestrate failover |
na_ontap_rest_info |
Read cluster state over REST | Read-only inventory, performance metrics, drift detection, and dynamic inventory sourcing |
Every one of these is idempotent and REST-driven. The examples that follow build the most common combinations of them, in dependency order; the enterprise scenarios further down show how teams compose them at scale.
SVM foundation
Create an SVM and declare its protocols
Job: create the storage tenant — the first object in every workflow, since volumes, LIFs, and shares all live inside an SVM. Module: na_ontap_svm (one task). File: create_pri_svm.yml
The lab original — exactly as it runs in the workshop
#!/usr/bin/env ansible-playbook
- hosts: localhost
  gather_facts: false
  vars:
    input: &input
      hostname:       "{{ PRI_CLU }}"
      username:       "{{ PRI_CLU_USER }}"
      password:       "{{ PRI_CLU_PASS }}"
      https:          true
      validate_certs: false
      use_rest:       Always
  vars_files:
    - global.vars
  collections:
    - netapp.ontap
  tasks:
  - name: Create primary SVM
    na_ontap_svm:
      state: present
      name:  "{{ PRI_SVM }}"
      services:
        nfs:
          allowed: true
          enabled: true
#        s3:
#          allowed: true
#          enabled: true
      comment: Created with Ansible
      <<: *input
The WUC-cleaned version — what we would run in production
#!/usr/bin/env ansible-playbook
- hosts: localhost
  gather_facts: false

  vars_files:
    - global.vars

  module_defaults:
    group/netapp.ontap.netapp_ontap:
      hostname: "{{ PRI_CLU }}"
      username: "{{ PRI_CLU_USER }}"
      password: "{{ PRI_CLU_PASS }}"
      https: true
      validate_certs: false        # lab certificate - set true in production
      use_rest: always

  tasks:
  - name: Create the primary SVM with the protocols it will serve
    netapp.ontap.na_ontap_svm:
      state: present
      name: "{{ PRI_SVM }}"
      comment: "Created with Ansible"
      services:
        nfs:
          allowed: true
          enabled: true
        # add only the protocols this SVM should ever serve, e.g.:
        # s3:
        #   allowed: true
        #   enabled: true
The run
[root@centos1 ansible-workshop]# ansible-playbook create_pri_svm.yml --ask-vault-pass
Vault password:

PLAY [localhost] ***************************************************************

TASK [Create primary SVM] ******************************************************
changed: [localhost]

PLAY RECAP *********************************************************************
localhost    : ok=1    changed=1    unreachable=0    failed=0    skipped=0
What to read in this one. The services block is the SVM’s protocol contract, and the two keys mean different things: allowed permits the protocol to exist on this SVM at all, enabled turns its service on. Declaring only what you need — NFS here, S3 commented out until wanted — is least privilege at the tenant level: a protocol that is not allowed cannot be misconfigured into serving data. This is the object every other entry in this reference depends on; in dependency order it always runs first.
This file is mostly clean already — it uses the modern services block and use_rest: Always. The cleaned version changes only the credential pattern (module_defaults instead of the &input anchor) and tidies the commented-out blocks: the original carries two parallel commented sections (a legacy allowed_protocols form and a certificate line) that are dead weight; the cleaned version keeps a single commented S3 stanza as the documented extension point. Note the design choice worth keeping from the original: protocols are declared at creation, not bolted on later — the SVM’s capability surface is defined in one reviewable place.
One module, every workflow. The workshop reuses this same create_pri_svm.yml across its NAS, S3, and SAN tracks — the only thing that changes is the services block (NFS here, or S3, or iSCSI as in 60-01). That is the whole point of declaring protocols at creation: one playbook, one module, and the tenant’s purpose set by which protocols you allow. The variants also carry a commented certificate: "server" line — a placeholder for the server certificate an S3 server (50-01) later requires, a reminder that the SVM and its certificate are born together.
Add a management LIF to an SVM
Job: give an existing SVM its own management interface, so storage admins can manage the tenant directly instead of through the cluster LIF. Module: na_ontap_interface (one task). File: 22_create_mgmtlif_pri_svm.yml
The lab original — exactly as it runs in the workshop
#!/usr/bin/env ansible-playbook
- hosts: localhost
  gather_facts: false
  vars:
    input: &input
      hostname:       "{{ PRI_CLU }}"
      username:       "{{ PRI_CLU_USER }}"
      password:       "{{ PRI_CLU_PASS }}"
      https:          true
      validate_certs: false
      use_rest:       Always
  vars_files:
    - global.vars
  collections:
    - netapp.ontap
  tasks:
  - name: Create management interface on primary SVM
    na_ontap_interface:
      state:           present
      interface_name:  "{{ PRI_SVM }}"
      vserver:         "{{ PRI_SVM }}"
      address:         "{{ PRI_SVM_IP }}"
      netmask:         "{{ PRI_SVM_NETMASK }}"
      home_node:       "{{ PRI_CLU_NODE1 }}"
      home_port:       "{{ PRI_MGMT_PORT }}"
      <<: *input
      service_policy:  "default-management"
      firewall_policy: mgmt
      role:            data
The WUC-cleaned version — what we would run in production
#!/usr/bin/env ansible-playbook
- hosts: localhost
  gather_facts: false

  vars_files:
    - global.vars

  module_defaults:
    group/netapp.ontap.netapp_ontap:
      hostname: "{{ PRI_CLU }}"
      username: "{{ PRI_CLU_USER }}"
      password: "{{ PRI_CLU_PASS }}"
      https: true
      validate_certs: false        # lab certificate - set true in production
      use_rest: always

  tasks:
  - name: Create the SVM management LIF
    netapp.ontap.na_ontap_interface:
      state: present
      vserver: "{{ PRI_SVM }}"
      interface_name: "{{ PRI_SVM }}_mgmt"
      address: "{{ PRI_SVM_IP }}"
      netmask: "{{ PRI_SVM_NETMASK }}"
      home_node: "{{ PRI_CLU_NODE1 }}"
      home_port: "{{ PRI_MGMT_PORT }}"
      service_policy: default-management
The run
[root@centos1 ansible-workshop]# ansible-playbook 22_create_mgmtlif_pri_svm.yml --ask-vault-pass
Vault password:

PLAY [localhost] ***************************************************************

TASK [Create management interface on primary SVM] ******************************
changed: [localhost]

PLAY RECAP *********************************************************************
localhost    : ok=1    changed=1    unreachable=0    failed=0    skipped=0
What to read in this one. An SVM management LIF is what lets a storage tenant be administered independently of the cluster — useful for delegated administration and for tools that connect per-SVM. The four placement parameters work together: home_node + home_port say where the interface lives, address + netmask say what it answers on. The service_policy is what makes it a management interface rather than a data one — default-management is the built-in policy that permits management traffic and nothing else, which is the least-privilege default you want on an admin LIF.
The same na_ontap_interface module creates data LIFs too — the difference is the service_policy: a data LIF for a protocol either takes the SVM default (no policy line) or names a protocol data policy like default-data-iscsi (see 60-01) or default-data-blocks. One module, three interface roles — management, NAS/object data, and block data — distinguished entirely by the service policy you attach.
This file is worth citing for one contradiction it carries: it sets service_policy: default-management (the REST-native field that defines an interface’s role) and the older firewall_policy: mgmt + role: data fields on the same task. Under REST the modern service_policy is authoritative and the older pair is redundant — harmless, but confusing to the next reader, and role: data on a management interface flatly contradicts the management service policy. The cleaned version keeps only service_policy, which is the single source of truth: an interface’s role is whatever its service policy permits. Two smaller fixes: the interface is named {{ PRI_SVM }}_mgmt rather than reusing the bare SVM name (an interface named identically to its SVM invites confusion in network interface show), and credentials move to module_defaults.
Configure DNS on an SVM
Job: point the SVM at a DNS server and domain — the quiet prerequisite that makes the Active Directory join (and any hostname-based access) work. Module: na_ontap_dns (one task). Depends on: the SVM (10-01). Required by: the CIFS server join (30-01).
The lab original — exactly as it runs in the workshop
#!/usr/bin/env ansible-playbook
- hosts: localhost
  gather_facts: false
  vars:
    input: &input
      hostname:       "{{ PRI_CLU }}"
      username:       "{{ PRI_CLU_USER }}"
      password:       "{{ PRI_CLU_PASS }}"
      https:          true
      validate_certs: false
      use_rest:       Always
  vars_files:
    - global.vars
  collections:
    - netapp.ontap
  tasks:
  - name: Create DNS on primary SVM
    na_ontap_dns:
      state:       present
      vserver:     "{{ PRI_SVM }}"
      domains:     "{{ PRI_DOMAIN }}"
      nameservers: "{{ PRI_DNS1 }}"
      <<: *input
The WUC-cleaned version — what we would run in production
#!/usr/bin/env ansible-playbook
- hosts: localhost
  gather_facts: false

  vars_files:
    - global.vars

  module_defaults:
    group/netapp.ontap.netapp_ontap:
      hostname: "{{ PRI_CLU }}"
      username: "{{ PRI_CLU_USER }}"
      password: "{{ PRI_CLU_PASS }}"
      https: true
      validate_certs: false        # lab certificate - set true in production
      use_rest: always

  tasks:
  - name: Configure DNS on the SVM
    netapp.ontap.na_ontap_dns:
      state: present
      vserver: "{{ PRI_SVM }}"
      domains:
        - "{{ PRI_DOMAIN }}"
      nameservers:
        - "{{ PRI_DNS1 }}"
        - "{{ PRI_DNS2 }}"          # list both - resilience if one resolver is down
The run
[root@centos1 ansible-workshop]# ansible-playbook create_dns_pri_svm.yml --ask-vault-pass
Vault password:

PLAY [localhost] ***************************************************************

TASK [Create DNS on primary SVM] **********************************************
changed: [localhost]

PLAY RECAP *********************************************************************
localhost    : ok=1    changed=1    unreachable=0    failed=0    skipped=0
What to read in this one. DNS is configured per SVM, not just at the cluster — because a data SVM joining Active Directory resolves the domain from its own network, using its own resolver. domains is the search domain, nameservers is the resolver to query. This task looks trivial and is — until you skip it, at which point the CIFS server join (30-01) fails with a domain-not-found error that sends people debugging the join when the real fault is one layer below. Run DNS first; the join just works.
The fix here is resilience, expressed through YAML types. Both domains and nameservers are lists — the original passes a single scalar to each (one domain, one resolver), which works but leaves the SVM with a single point of DNS failure: if PRI_DNS1 is down, name resolution stops and SMB access with it. The cleaned version writes them as proper YAML lists and adds PRI_DNS2 (already in global.vars) as a second resolver. One resolver is a lab; two is production. Credentials move to module_defaults as elsewhere.
Add a network route to an SVM
Job: give the SVM a route so its LIFs can reach clients on other subnets — the networking piece that turns a reachable interface into a reachable service. Module: na_ontap_net_routes (one task). File: 36_create_route_pri_svm.yml. Depends on: the SVM (10-01) and at least one data LIF.
The lab original — exactly as it runs in the workshop
#!/usr/bin/env ansible-playbook
- hosts: localhost
  gather_facts: false
  vars:
    input: &input
      hostname:       "{{ PRI_CLU }}"
      username:       "{{ PRI_CLU_USER }}"
      password:       "{{ PRI_CLU_PASS }}"
      https:          true
      validate_certs: false
      use_rest:       Always
  vars_files:
    - global.vars
  collections:
    - netapp.ontap
  tasks:
  - name: Create route on primary SVM
    na_ontap_net_routes:
      state:       present
      vserver:     "{{ PRI_SVM }}"
      destination: "192.168.0.0/24"
      gateway:     "{{ PRI_CLU_DEFAULT_GW }}"
      <<: *input
The WUC-cleaned version — what we would run in production
#!/usr/bin/env ansible-playbook
- hosts: localhost
  gather_facts: false

  vars_files:
    - global.vars

  module_defaults:
    group/netapp.ontap.netapp_ontap:
      hostname: "{{ PRI_CLU }}"
      username: "{{ PRI_CLU_USER }}"
      password: "{{ PRI_CLU_PASS }}"
      https: true
      validate_certs: false        # lab certificate - set true in production
      use_rest: always

  tasks:
  - name: Add the default route for the SVM
    netapp.ontap.na_ontap_net_routes:
      state: present
      vserver: "{{ PRI_SVM }}"
      destination: "0.0.0.0/0"          # default route - reach any subnet
      gateway: "{{ PRI_CLU_DEFAULT_GW }}"
The run
[root@centos1 ansible-workshop]# ansible-playbook 36_create_route_pri_svm.yml --ask-vault-pass
Vault password:

PLAY [localhost] ***************************************************************

TASK [Create route on primary SVM] ********************************************
changed: [localhost]

PLAY RECAP *********************************************************************
localhost    : ok=1    changed=1    unreachable=0    failed=0    skipped=0
What to read in this one. Like DNS, routing on a data SVM is per-SVM — an SVM has its own routing table, separate from the cluster’s. A LIF (10-02) gives the SVM an address on its local subnet; a route is what lets it answer clients that live on other subnets. destination is the network to reach and gateway is the next hop toward it. Without a route to a client’s subnet, that client can reach the LIF only if it happens to share the subnet — the subtle cause of “works for some clients, times out for others.”
One meaningful choice. The original scopes the route to a single subnet (destination: 192.168.0.0/24), which reaches exactly that network and nothing else. The cleaned version uses the default route 0.0.0.0/0 — the catch-all that sends any otherwise-unmatched traffic to the gateway, which is what most data SVMs actually want so clients on any routed subnet can connect. Use a specific destination only when you deliberately want to limit which networks the SVM can reach (a valid hardening choice); use the default route when the SVM should serve broadly. The original’s slightly mismatched indentation on gateway is also tidied — harmless to YAML, but consistent indentation is the difference between a file that reviews cleanly and one that invites a second look. Credentials move to module_defaults.
Volumes
Create a NAS volume and mount it into the namespace
Job: carve capacity from an aggregate and mount it at a junction path, so NAS clients can reach it — the layer between the SVM and any share or export. Module: na_ontap_volume (one task). File: create_nfsvol_pri_svm.yml. Depends on: the SVM (10-01).
The lab original — exactly as it runs in the workshop
#!/usr/bin/env ansible-playbook
- hosts: localhost
  gather_facts: false
  vars:
    input: &input
      hostname:       "{{ PRI_CLU }}"
      username:       "{{ PRI_CLU_USER }}"
      password:       "{{ PRI_CLU_PASS }}"
      https:          true
      validate_certs: false
      use_rest:       Always
  vars_files:
    - global.vars
  collections:
    - netapp.ontap
  tasks:
  - name: Create volume on primary SVM
    na_ontap_volume:
      state:                 present
      name:                  "{{ PRI_SVM }}_nfs_01"
      vserver:               "{{ PRI_SVM }}"
      size:                  "{{ VOL_SIZE }}"
      size_unit:             mb
      aggregate_name:        "{{ PRI_AGGR }}"
      comment:               Created with Ansible
#      space_guarantee:       volume
      policy:                default
      junction_path:         "/{{ PRI_SVM }}_nfs_01"
      volume_security_style: unix
      <<: *input
The WUC-cleaned version — what we would run in production
#!/usr/bin/env ansible-playbook
- hosts: localhost
  gather_facts: false

  vars_files:
    - global.vars

  module_defaults:
    group/netapp.ontap.netapp_ontap:
      hostname: "{{ PRI_CLU }}"
      username: "{{ PRI_CLU_USER }}"
      password: "{{ PRI_CLU_PASS }}"
      https: true
      validate_certs: false        # lab certificate - set true in production
      use_rest: always

  tasks:
  - name: Create the NFS volume and mount it in the namespace
    netapp.ontap.na_ontap_volume:
      state: present
      vserver: "{{ PRI_SVM }}"
      name: "{{ PRI_SVM }}_nfs_01"
      aggregate_name: "{{ PRI_AGGR }}"
      size: "{{ VOL_SIZE }}"
      size_unit: gb                     # GiB - see note on units below
      junction_path: "/{{ PRI_SVM }}_nfs_01"
      volume_security_style: unix
      space_guarantee: none
      export_policy: default
      comment: "NFS volume - managed by Ansible"
The run
[root@centos1 ansible-workshop]# ansible-playbook create_nfsvol_pri_svm.yml --ask-vault-pass
Vault password:

PLAY [localhost] ***************************************************************

TASK [Create volume on primary SVM] *******************************************
changed: [localhost]

PLAY RECAP *********************************************************************
localhost    : ok=1    changed=1    unreachable=0    failed=0    skipped=0
What to read in this one. Four decisions define a NAS volume. aggregate_name is which physical pool backs it. size + size_unit is how big (two fields, always set both). junction_path is what makes it reachable — an unmounted volume exists but no client can see it, the silent cause of “the export is empty” tickets. And volume_security_style: unix matches the NFS consumers coming next — UNIX mode bits govern permissions, where an SMB volume would use ntfs. With the volume mounted, an export policy is the next layer.
Two substantive fixes and a recurring one. Size unit: the original uses size_unit: mb — with VOL_SIZE at 20 that is a 20 MB volume, almost certainly not intended; the cleaned version uses gb, which is what a NAS volume actually wants. This is the kind of unit slip that passes every syntax check and only surfaces when the share fills in a day. Space guarantee: the original comments out space_guarantee entirely (defaulting to the cluster setting); the cleaned version states none explicitly — thin-provisioned and intentional, not implicit. Export policy: renamed from the bare policy: default to the explicit export_policy: default, the unambiguous modern parameter. Credentials move to module_defaults as everywhere else.
The SMB variant: one parameter different. The workshop ships a near-identical 26_create_cifsvol_pri_svm.yml for SMB — same module, same structure, with volume_security_style: ntfs instead of unix so Windows ACLs govern the files. That single field is the whole difference between a NAS volume destined for an NFS export and one destined for an SMB share. The SMB file also sets space_guarantee: volume rather than none — the thick option, which reserves the full size from the aggregate up front. Thick guarantees the space can never be over-committed; thin (none) lets you over-provision and monitor. Choose deliberately: thick for workloads that must never hit a space error, thin for density with the monitoring to back it. Set security_style to match the protocol, space_guarantee to match the risk tolerance — everything else about the two volumes is identical.
NAS (SMB & NFS)
Join an SVM to Active Directory (create a CIFS server)
Job: give the SVM an SMB identity by joining it to Active Directory — the prerequisite every SMB share depends on, and the step most quick-starts skip. Module: na_ontap_cifs_server (one task). File: create_cifs_pri_svm.yml. Depends on: the SVM (10-01) with CIFS allowed.
The lab original — exactly as it runs in the workshop
#!/usr/bin/env ansible-playbook
- hosts: localhost
  gather_facts: false
  vars:
    input: &input
      hostname:       "{{ PRI_CLU }}"
      username:       "{{ PRI_CLU_USER }}"
      password:       "{{ PRI_CLU_PASS }}"
      https:          true
      validate_certs: false
      use_rest:       Always
  vars_files:
    - global.vars
  collections:
    - netapp.ontap
  tasks:
  - name: Create CIFS server on primary SVM
    na_ontap_cifs_server:
      state:           present
      name:            "{{ PRI_SVM }}"
      vserver:         "{{ PRI_SVM }}"
      domain:          "{{ PRI_AD_DOMAIN }}"
      admin_user_name: "{{ PRI_AD_USER }}"
      admin_password:  "{{ PRI_AD_PASS }}"
      <<: *input
The WUC-cleaned version — what we would run in production
#!/usr/bin/env ansible-playbook
- hosts: localhost
  gather_facts: false

  vars_files:
    - global.vars

  module_defaults:
    group/netapp.ontap.netapp_ontap:
      hostname: "{{ PRI_CLU }}"
      username: "{{ PRI_CLU_USER }}"
      password: "{{ PRI_CLU_PASS }}"
      https: true
      validate_certs: false        # lab certificate - set true in production
      use_rest: always

  tasks:
  - name: Join the SVM to Active Directory as a CIFS server
    netapp.ontap.na_ontap_cifs_server:
      state: present
      vserver: "{{ PRI_SVM }}"
      name: "{{ PRI_SVM }}_smb"          # the AD computer object + UNC name
      domain: "{{ PRI_AD_DOMAIN }}"
      admin_user_name: "{{ PRI_AD_USER }}"
      admin_password: "{{ PRI_AD_PASS }}"
      service_state: started
      # ou: "OU=Storage,DC=demo,DC=netapp,DC=com"   # place the object precisely
The run
[root@centos1 ansible-workshop]# ansible-playbook create_cifs_pri_svm.yml --ask-vault-pass
Vault password:

PLAY [localhost] ***************************************************************

TASK [Create CIFS server on primary SVM] **************************************
changed: [localhost]

PLAY RECAP *********************************************************************
localhost    : ok=1    changed=1    unreachable=0    failed=0    skipped=0
What to read in this one. This single task performs a real Active Directory domain join: name becomes the computer object created in AD and the server half of the UNC path (\\name\share), domain is the AD domain to join, and admin_user_name / admin_password are the join credentials — an account with rights to create computer objects in the target OU. Those credentials are why global.vars is vault-encrypted: they are domain credentials, not just storage ones. The join happens from the SVM’s network, so the SVM’s DNS must resolve the domain — the most common cause of a failed join, which is why DNS (10-03) runs first.
Two naming and operational refinements. Server name: the original sets the CIFS server name equal to the SVM name — legal, but it makes the AD computer object indistinguishable from the SVM in logs and in vserver cifs show; the cleaned version uses {{ PRI_SVM }}_smb so the SMB identity is its own recognizable thing. Explicit start + OU: the cleaned version adds service_state: started (don’t assume the default) and shows a commented ou: parameter — in a real domain you place the computer object in a specific OU rather than the default Computers container, which is often a security or GPO requirement. The join credentials and domain stay as the original had them; they are already coming from vaulted variables, which is correct.
Publish an SMB share
Job: expose a path on the SVM as a Windows file share — the last NAS step, where storage becomes a drive someone can map. Module: na_ontap_cifs (one task). File: create_cifsshare_pri_svm.yml. Depends on: the volume (20-01, ntfs variant) and the CIFS server (30-01).
The lab original — exactly as it runs in the workshop
#!/usr/bin/env ansible-playbook
- hosts: localhost
  gather_facts: false
  vars:
    input: &input
      hostname:       "{{ PRI_CLU }}"
      username:       "{{ PRI_CLU_USER }}"
      password:       "{{ PRI_CLU_PASS }}"
      https:          true
      validate_certs: false
      use_rest:       Always
  vars_files:
    - global.vars
  collections:
    - netapp.ontap
  tasks:
  - name: Create CIFS share on primary SVM
    na_ontap_cifs:
      state:      present
      share_name: "share_01"
      vserver:    "{{ PRI_SVM }}"
      path:       "/{{ PRI_SVM }}_cifs_01/cifs_01/"
      <<: *input
The WUC-cleaned version — what we would run in production
#!/usr/bin/env ansible-playbook
- hosts: localhost
  gather_facts: false

  vars_files:
    - global.vars

  module_defaults:
    group/netapp.ontap.netapp_ontap:
      hostname: "{{ PRI_CLU }}"
      username: "{{ PRI_CLU_USER }}"
      password: "{{ PRI_CLU_PASS }}"
      https: true
      validate_certs: false        # lab certificate - set true in production
      use_rest: always

  tasks:
  - name: Publish the SMB share
    netapp.ontap.na_ontap_cifs:
      state: present
      vserver: "{{ PRI_SVM }}"
      name: share_01
      path: "/{{ PRI_SVM }}_cifs_01/cifs_01"
      comment: "Project share - managed by Ansible"
The run
[root@centos1 ansible-workshop]# ansible-playbook create_cifsshare_pri_svm.yml --ask-vault-pass
Vault password:

PLAY [localhost] ***************************************************************

TASK [Create CIFS share on primary SVM] ***************************************
changed: [localhost]

PLAY RECAP *********************************************************************
localhost    : ok=1    changed=1    unreachable=0    failed=0    skipped=0

# from a domain-joined Windows client, the share now maps:
C:\> net use Z: \\nas_svm_smb\share_01
The command completed successfully.
What to read in this one. A share is just a name mapped to a path inside the SVM namespace — clients connect to \\server\share_01 and land at the path you specify. The path arithmetic is the part that must line up: the volume mounted at /{{ PRI_SVM }}_cifs_01 (the ntfs volume from 20-01), then the qtree cifs_01 inside it, so the share path is junction + qtree. Point it one segment wrong and the share either fails or publishes the wrong directory. Who can do what on the share is governed separately by NTFS ACLs on the files plus share-level ACLs (na_ontap_cifs_acl); this task only publishes the name.
Two small correctness fixes. Trailing slash: the original’s path: "/..._cifs_01/cifs_01/" carries a trailing slash; ONTAP tolerates it, but share paths are canonically written without one, and a stray slash occasionally trips path-equality checks on re-runs. The cleaned version drops it. Parameter name: the original uses share_name; the module’s current canonical parameter is name (with share_name kept as an alias) — the cleaned version uses name to match the rest of the collection, and adds a comment so the share is self-documenting in vserver cifs share show. Credentials move to module_defaults.
Add an NFS export policy rule
Job: grant NFS clients access by adding a rule to an export policy — the NFS equivalent of publishing a share, and the step that decides who may mount. Module: na_ontap_export_policy_rule (one task). File: create_export_policy_rule.yml. Depends on: the volume (20-01) attached to this policy, plus the NFS service enabled on the SVM.
The lab original — exactly as it runs in the workshop
#!/usr/bin/env ansible-playbook
- hosts: localhost
  gather_facts: false
  vars:
    input: &input
      hostname:       "{{ PRI_CLU }}"
      username:       "{{ PRI_CLU_USER }}"
      password:       "{{ PRI_CLU_PASS }}"
      https:          true
      validate_certs: false
      use_rest:       Always
  vars_files:
    - global.vars
  collections:
    - netapp.ontap
  tasks:
  - name: Create export policy rule for svm.
    na_ontap_export_policy_rule:
      state:               present
      name:                default
      vserver:             "{{ PRI_SVM }}"
      client_match:        192.168.0.0/24
      ro_rule:             any
      rw_rule:             any
      protocol:            nfs3
      super_user_security: any
      anonymous_user_id:   65534
      <<: *input
The WUC-cleaned version — what we would run in production
#!/usr/bin/env ansible-playbook
- hosts: localhost
  gather_facts: false

  vars_files:
    - global.vars

  module_defaults:
    group/netapp.ontap.netapp_ontap:
      hostname: "{{ PRI_CLU }}"
      username: "{{ PRI_CLU_USER }}"
      password: "{{ PRI_CLU_PASS }}"
      https: true
      validate_certs: false        # lab certificate - set true in production
      use_rest: always

  tasks:
  - name: Add the project network to the export policy, read-write
    netapp.ontap.na_ontap_export_policy_rule:
      state: present
      vserver: "{{ PRI_SVM }}"
      name: default
      client_match: "{{ nfs_client_network }}"   # one CIDR from vars, not the world
      protocol: nfs
      ro_rule: sys                 # require AUTH_SYS, not "any"
      rw_rule: sys
      super_user_security: none    # squash root from clients
      allow_suid: false
The run
[root@centos1 ansible-workshop]# ansible-playbook create_export_policy_rule.yml --ask-vault-pass
Vault password:

PLAY [localhost] ***************************************************************

TASK [Create export policy rule for svm.] *************************************
changed: [localhost]

PLAY RECAP *********************************************************************
localhost    : ok=1    changed=1    unreachable=0    failed=0    skipped=0

# from a client in the allowed network, the export now mounts:
$ sudo mount -t nfs nas_svm:/nas_svm_nfs_01 /mnt/nfs
$ df -h /mnt/nfs
Filesystem            Size  Used Avail Use% Mounted on
nas_svm:/nas_svm_nfs_01  19G  256K   19G   1% /mnt/nfs
What to read in this one. NFS access control is unlike SMB’s: there is no per-user authentication at mount time by default. Instead an export policy is a named, ordered list of rules, and each rule matches client machines by address (client_match) and grants them read-only (ro_rule) and read-write (rw_rule) access. A volume points at one policy; this task adds a rule to that policy. The empty-policy trap is the classic NFS incident: a volume attached to a policy with no matching rule mounts nowhere, because ONTAP’s default for “no rule matched” is deny.
This is a security entry: the lab rule is wide open and the cleaned one is least privilege. The original sets ro_rule: any / rw_rule: any with a hard-coded 192.168.0.0/24 — any means “no authentication required,” which reads in an audit as “anyone on this subnet has unauthenticated read-write.” The cleaned version requires AUTH_SYS (ro_rule: sys, rw_rule: sys), squashes root from clients (super_user_security: none — a root user on a workstation becomes the anonymous user on the export, so owning a laptop is not owning the data), disables suid, and pulls the network from a nfs_client_network variable instead of a literal. protocol: nfs3 also becomes the broader nfs unless you specifically need to pin v3. The original’s anonymous_user_id: 65534 (the “nobody” uid) is fine and kept implicitly by the squash. Same module, same policy — the difference is entirely in how much it trusts the client.
S3 / object storage
Stand up an S3 server on an SVM
Job: turn an existing SVM into an S3 endpoint, so object clients (backup tools, cloud-native apps) can talk to the cluster like AWS. Module: na_ontap_s3_services (one task). File: create_s3_server.yml
The lab original — exactly as it runs in the workshop
#!/usr/bin/env ansible-playbook
#
# Procedure to get the certificate name:
# 1. System Manager > Cluster > Settings > Certificates > Client/Server
# 2. Find the cert for the SVM you created (e.g. nas_svm)
# 3. Note it: e.g. nas_svm_97BBD25E15519CA
#
- hosts: localhost
  gather_facts: false
  vars:
    input: &input
      hostname:       "{{ PRI_CLU }}"
      username:       "{{ PRI_CLU_USER }}"
      password:       "{{ PRI_CLU_PASS }}"
      https:          true
      validate_certs: false
      use_rest:       Always
  vars_files:
    - global.vars
  collections:
    - netapp.ontap
  tasks:
  - name: Create an s3 service on primary SVM
    na_ontap_s3_services:
      state:            present
      name:             "s3_server"
      vserver:          "{{ PRI_SVM }}"
      comment:          enabled
      enabled:          true
      certificate_name: nas_svm_97BBD25E15519CA
      <<: *input
#    register: result
#  - name: print variables
#    ansible.builtin.debug:
#      msg: Access Key {{ result.access_key }} and Secret Key {{ result.secret_key }}
The WUC-cleaned version — what we would run in production
#!/usr/bin/env ansible-playbook
- hosts: localhost
  gather_facts: false

  vars_files:
    - global.vars

  module_defaults:
    group/netapp.ontap.netapp_ontap:
      hostname: "{{ PRI_CLU }}"
      username: "{{ PRI_CLU_USER }}"
      password: "{{ PRI_CLU_PASS }}"
      https: true
      validate_certs: false        # lab certificate - set true in production
      use_rest: always

  tasks:
  - name: Create the S3 server on the SVM
    netapp.ontap.na_ontap_s3_services:
      state: present
      vserver: "{{ PRI_SVM }}"
      name: s3_server
      enabled: true
      comment: "S3 endpoint - managed by Ansible"
      certificate_name: "{{ s3_certificate_name }}"   # from vars, not hard-coded
    register: s3_service

  - name: Show the root-user keys ONCE - store them in your secrets manager now
    ansible.builtin.debug:
      msg:
        - "access_key: {{ s3_service.access_key | default('(unchanged - keys only issued at creation)') }}"
        - "secret_key: {{ s3_service.secret_key | default('(unchanged - keys only issued at creation)') }}"
The run
[root@centos1 ansible-workshop]# ansible-playbook create_s3_server.yml --ask-vault-pass
Vault password:

PLAY [localhost] ***************************************************************

TASK [Create an s3 service on primary SVM] *************************************
changed: [localhost]

PLAY RECAP *********************************************************************
localhost    : ok=1    changed=1    unreachable=0    failed=0    skipped=0
What to read in this one. An S3 server is per-SVM, and it needs a server certificate for HTTPS — which is the one manual prerequisite this task cannot invent: the certificate is created with the SVM, and you supply its name here. The lab header documents exactly where to find it (System Manager → Cluster → Settings → Certificates), because the name is cluster-generated and unguessable. Once the server is enabled, the SVM answers S3 over its data LIF — which is the one piece of plumbing this task assumes already exists.
Companion: the S3 data LIF. S3 clients reach the server over a data interface, created with the same na_ontap_interface module as the management LIF in 10-02 — but with no service_policy, because a plain data LIF takes the SVM’s default. Run this alongside the server:
  tasks:
  - name: Create the S3 data LIF clients connect to
    netapp.ontap.na_ontap_interface:
      state: present
      vserver: "{{ PRI_SVM }}"
      interface_name: "{{ PRI_SVM }}_s3_01"
      address: "{{ PRI_SVM_S3_IP }}"
      netmask: "{{ PRI_SVM_S3_NETMASK }}"
      home_node: "{{ PRI_CLU_NODE1 }}"
      home_port: "{{ PRI_DATA_PORT }}"
      # module_defaults supplies the connection block; no service_policy
      # needed - a data LIF inherits the SVM default. For two-path
      # redundancy, add a second LIF on PRI_CLU_NODE2, as the SAN
      # example (60-01) does for iSCSI.
Then creating users and buckets follows — covered in 50-02 through 50-04 below.
Two things the original commented out are worth turning back on, which the cleaned version does. First, certificate_name is hard-coded to a specific cluster’s generated string — fine in a lab, but it makes the file non-portable; the cleaned version reads it from a s3_certificate_name variable so the playbook moves between clusters unchanged. Second, the original’s commented register + debug block is the most important part of the whole file: ONTAP issues the S3 root user’s access and secret keys once, at service creation, and never again. The cleaned version restores that capture with a default() guard so re-runs print a calm placeholder instead of failing — lose those keys and you regenerate, never recover. comment: enabled in the original is also just a stray value (the comment field set to the word “enabled”); the cleaned version gives it a real description.
The enabled flag is a staging control. The workshop ships this file in two forms — one with enabled: true (shown above) and one with enabled: false — because the same task can provision the S3 server without turning it on. That is a deliberate production pattern: create the endpoint during a change window, validate certificate and LIF reachability, then flip enabled: true in a separate run to take it live. Because the module is idempotent, that second run changes only the one field. Same task, two roles — deploy and activate.
Create a reusable S3 access policy
Job: define a named, standalone permission set that groups can attach by name — the reusable alternative to the built-in FullAccess and to inline bucket policies. Module: na_ontap_s3_policies (one task). File: create_s3_policy.yml. Used by: the group in 50-03.
The lab original — exactly as it runs in the workshop
#!/usr/bin/env ansible-playbook
- hosts: localhost
  gather_facts: false
  vars:
    input: &input
      hostname:       "{{ PRI_CLU }}"
      username:       "{{ PRI_CLU_USER }}"
      password:       "{{ PRI_CLU_PASS }}"
      https:          true
      validate_certs: false
      use_rest:       Always
  vars_files:
    - global.vars
  collections:
    - netapp.ontap
  tasks:
  - name: Create an s3 policies
    na_ontap_s3_policies:
      state:   present
      name:    "{{ S3_Policy }}"
      vserver: "{{ PRI_SVM }}"
      comment: Created with Ansible
      statements:
        - sid: 1
          resources:
          - "*"
          actions:
            - "*"
          effect: allow
      <<: *input
The WUC-cleaned version — what we would run in production
#!/usr/bin/env ansible-playbook
- hosts: localhost
  gather_facts: false

  vars_files:
    - global.vars

  module_defaults:
    group/netapp.ontap.netapp_ontap:
      hostname: "{{ PRI_CLU }}"
      username: "{{ PRI_CLU_USER }}"
      password: "{{ PRI_CLU_PASS }}"
      https: true
      validate_certs: false        # lab certificate - set true in production
      use_rest: always

  tasks:
  - name: Create a scoped, reusable S3 access policy
    netapp.ontap.na_ontap_s3_policies:
      state: present
      vserver: "{{ PRI_SVM }}"
      name: "{{ S3_Policy }}"
      comment: "Read/write to the project bucket - managed by Ansible"
      statements:
        - sid: AllowProjectBucketReadWrite
          effect: allow
          resources:
            - "{{ S3_Bucket }}"
            - "{{ S3_Bucket }}/*"
          actions:
            - GetObject
            - PutObject
            - DeleteObject
            - ListBucket
The run
[root@centos1 ansible-workshop]# ansible-playbook create_s3_policy.yml --ask-vault-pass
Vault password:

PLAY [localhost] ***************************************************************

TASK [Create an s3 policies] ***************************************************
changed: [localhost]

PLAY RECAP *********************************************************************
localhost    : ok=1    changed=1    unreachable=0    failed=0    skipped=0
What to read in this one. A standalone policy is the reusable middle layer of the S3 model: define the permission set once, then attach it by name to any group (as in 50-03) instead of repeating inline policy on every bucket. The statement grammar is identical to a bucket policy — resources, actions, effect, optional principals — the difference is only where it lives: a bucket policy is attached to one bucket, a named policy is reusable across groups. This is how you replace the built-in FullAccess that 50-03 flagged.
This is the entry where the original is a deliberate anti-example, and the cleaned version is the lesson. The lab file grants actions: ["*"] on resources: ["*"] — every action on every resource, which is FullAccess rewritten by hand and the exact thing a custom policy exists to avoid. It runs, it is valid, and it is wrong for production. The cleaned version scopes both lists: specific actions on the project bucket and its objects only, with a descriptive sid instead of 1. The original’s commented-out lines (the per-bucket resources and a sm_s3_user principal) show the author knew the scoped form — the cleaned version simply uncomments that intent. If you take one habit from this reference, take this one: a wildcard policy is a finding, a scoped policy is a control.
Create an S3 group that binds a user to a policy
Job: grant an S3 user access by placing them in a group that carries an access policy — the group is where identity meets permission. Module: na_ontap_s3_groups (one task). File: create_s3_group.yml. Depends on: the S3 server (50-01) and an S3 user already existing.
The lab original — exactly as it runs in the workshop
#!/usr/bin/env ansible-playbook
- hosts: localhost
  gather_facts: false
  vars:
    input: &input
      hostname:       "{{ PRI_CLU }}"
      username:       "{{ PRI_CLU_USER }}"
      password:       "{{ PRI_CLU_PASS }}"
      https:          true
      validate_certs: false
      use_rest:       Always
  vars_files:
    - global.vars
  collections:
    - netapp.ontap
  tasks:
  - name: Create a S3 Group
    na_ontap_s3_groups:
      state:    present
      name:     "{{ S3_Group }}"
      vserver:  "{{ PRI_SVM }}"
      users:
        - name: "{{ S3_User }}"
      policies:
        - name: FullAccess
      comment:  Created with Ansible
      <<: *input
The WUC-cleaned version — what we would run in production
#!/usr/bin/env ansible-playbook
- hosts: localhost
  gather_facts: false

  vars_files:
    - global.vars

  module_defaults:
    group/netapp.ontap.netapp_ontap:
      hostname: "{{ PRI_CLU }}"
      username: "{{ PRI_CLU_USER }}"
      password: "{{ PRI_CLU_PASS }}"
      https: true
      validate_certs: false        # lab certificate - set true in production
      use_rest: always

  tasks:
  - name: Create the S3 group and bind the user to a policy
    netapp.ontap.na_ontap_s3_groups:
      state: present
      vserver: "{{ PRI_SVM }}"
      name: "{{ S3_Group }}"
      comment: "S3 access group - managed by Ansible"
      users:
        - name: "{{ S3_User }}"
      policies:
        - name: FullAccess          # least privilege: prefer a scoped custom
                                     # policy over FullAccess in production
The run
[root@centos1 ansible-workshop]# ansible-playbook create_s3_group.yml --ask-vault-pass
Vault password:

PLAY [localhost] ***************************************************************

TASK [Create a S3 Group] *******************************************************
changed: [localhost]

PLAY RECAP *********************************************************************
localhost    : ok=1    changed=1    unreachable=0    failed=0    skipped=0
What to read in this one. ONTAP’s S3 authorization model mirrors AWS IAM: a user is an identity with keys, a policy is a set of permissions, and a group is the join between them — you attach policies to a group and add users to it, rather than granting permissions to users directly. Both users and policies are lists, so one group can hold many members and carry several policies; the module reconciles the group to exactly the membership you declare, which is what makes re-runs safe. FullAccess is a built-in policy — convenient for a lab, and the one line to revisit before production.
This file is already well-formed — the cleaned version only swaps the &input anchor for module_defaults and gives the comment a real description. The substantive note is a security one, flagged inline: policies: [FullAccess] grants the group unrestricted access to every bucket on the SVM. That is fine in the workshop, but in production the group should carry the scoped custom policy from 50-02 instead — read/write to named buckets only. The grammar is identical; you simply replace FullAccess with the name of the policy you defined in 50-02.
Create an S3 bucket with a least-privilege access policy
Job: create the object container itself and attach a policy that says exactly who can do what to it — the last step that makes the S3 endpoint usable. Module: na_ontap_s3_buckets (one task). File: create_s3_bucket.yml. Depends on: the S3 server (50-01) and the user named in the policy.
The lab original — exactly as it runs in the workshop
#!/usr/bin/env ansible-playbook
- hosts: localhost
  gather_facts: false
  vars:
    input: &input
      hostname:       "{{ PRI_CLU }}"
      username:       "{{ PRI_CLU_USER }}"
      password:       "{{ PRI_CLU_PASS }}"
      https:          true
      validate_certs: false
      use_rest:       Always
  vars_files:
    - global.vars
  collections:
    - netapp.ontap
  tasks:
  - name: Create a S3 bucket
    na_ontap_s3_buckets:
      state:      present
      name:       "s3-bucket"
      vserver:    "{{ PRI_SVM }}"
      aggregates: "{{ PRI_AGGR }}"
      size:       102005473280
      policy:
        statements:
          - sid: 1
            resources:
              - s3-bucket
              - s3-bucket/*
            actions:
              - GetObject
              - PutObject
              - DeleteObject
              - ListBucket
            effect: allow
            principals:
              - s3_user
      comment:    "Container for S3 objects"
      <<: *input
The WUC-cleaned version — what we would run in production
#!/usr/bin/env ansible-playbook
- hosts: localhost
  gather_facts: false

  vars_files:
    - global.vars

  module_defaults:
    group/netapp.ontap.netapp_ontap:
      hostname: "{{ PRI_CLU }}"
      username: "{{ PRI_CLU_USER }}"
      password: "{{ PRI_CLU_PASS }}"
      https: true
      validate_certs: false        # lab certificate - set true in production
      use_rest: always

  tasks:
  - name: Create the S3 bucket with a scoped access policy
    netapp.ontap.na_ontap_s3_buckets:
      state: present
      vserver: "{{ PRI_SVM }}"
      name: "{{ S3_Bucket }}"
      aggregates:
        - "{{ PRI_AGGR }}"
      size: 95   # GiB - see note on size units below
      size_unit: gb
      comment: "Container for S3 objects - managed by Ansible"
      policy:
        statements:
          - sid: AllowAppReadWrite
            effect: allow
            principals:
              - "{{ S3_User }}"
            resources:
              - "{{ S3_Bucket }}"
              - "{{ S3_Bucket }}/*"
            actions:
              - GetObject
              - PutObject
              - DeleteObject
              - ListBucket
The run
[root@centos1 ansible-workshop]# ansible-playbook create_s3_bucket.yml --ask-vault-pass
Vault password:

PLAY [localhost] ***************************************************************

TASK [Create a S3 bucket] ******************************************************
changed: [localhost]

PLAY RECAP *********************************************************************
localhost    : ok=1    changed=1    unreachable=0    failed=0    skipped=0
What to read in this one. The bucket policy is the same statement grammar as an AWS S3 policy: a principals list (who), an actions list (what they may do), a resources list (on what), and an effect of allow or deny. The two resource lines are both required and mean different things — s3-bucket is the bucket itself (needed for ListBucket), s3-bucket/* is the objects inside it (needed for Get/Put/Delete). Name only the principals that should have access and only the actions they need; this policy is already close to least privilege, which is exactly right for a bucket.
Three improvements, one of which matters at 2 a.m. Size units: the original’s size: 102005473280 is a raw byte count — correct (~95 GiB) but unreviewable; a typo of one digit is a 10× mistake nobody catches in review. The cleaned version uses size: 95 + size_unit: gb, which a human can verify at a glance. Descriptive sid: the original’s sid: 1 (a numbered statement, with the descriptive FullAccessTos3-user commented out just above it) becomes a named AllowAppReadWrite — statement IDs should describe intent so a policy audit reads like English. Hard-coded names: s3-bucket and s3_user are literals in the original; the cleaned version uses the {{ S3_Bucket }} and {{ S3_User }} variables already defined in global.vars, so the file is portable and the bucket name stays consistent between its definition and its policy. aggregates is also written as a proper YAML list, which the module expects.
SAN / block
Provision a complete iSCSI SAN service: SVM, LIFs, igroup, volume, LUN, map
Job: from nothing to a Windows host seeing a disk — one playbook builds the SAN tenant and every layer inside it, in dependency order. Modules: na_ontap_svm, na_ontap_iscsi, na_ontap_interface ×2, na_ontap_igroup, na_ontap_volume, na_ontap_lun, na_ontap_lun_map. File: create_san_all.yml
The lab original — exactly as it runs in the workshop
#!/usr/bin/env ansible-playbook
- hosts: localhost
  gather_facts: false
  vars:
    input: &input
      hostname:       "{{ PRI_CLU }}"
      username:       "{{ PRI_CLU_USER }}"
      password:       "{{ PRI_CLU_PASS }}"
      https:          true
      validate_certs: false
#      use_rest:       Always
  vars_files:
    - global.vars
  collections:
    - netapp.ontap
  tasks:
  - name: Create primary SVM
    na_ontap_svm:
      state:   present
      name:    "{{ PRI_SVM }}"
      comment: Created with Ansible
      <<: *input
  - name: Enable iSCSI on primary SVM
    na_ontap_iscsi:
      state:         present
      vserver:       "{{ PRI_SVM }}"
      service_state: started
      <<: *input
  - name: Create iSCSI interface for node01
    na_ontap_interface:
      state:           present
      interface_name:  "{{ PRI_SVM }}_iscsi_01"
      vserver:         "{{ PRI_SVM }}"
      address:         "{{ PRI_ISCSI_IP }}"
      netmask:         "{{ PRI_SVM_NETMASK }}"
      home_node:       "{{ PRI_CLU_NODE1 }}"
      home_port:       "{{ PRI_DATA_PORT }}"
      protocols:       iscsi
      <<: *input
      firewall_policy: data
      role:            data
  - name: Create iSCSI interface for node02
    na_ontap_interface:
      state:           present
      interface_name:  "{{ PRI_SVM }}_iscsi_02"
      vserver:         "{{ PRI_SVM }}"
      address:         "{{ SEC_ISCSI_IP }}"
      netmask:         "{{ PRI_SVM_NETMASK }}"
      home_node:       "{{ PRI_CLU_NODE2 }}"
      home_port:       "{{ PRI_DATA_PORT }}"
      protocols:       iscsi
      <<: *input
      firewall_policy: data
      role:            data
  - name: Create iGroup
    na_ontap_igroup:
       state:                present
       name:                 "{{ IGROUP_NAME }}"
       vserver:              "{{ PRI_SVM }}"
       initiator_group_type: iscsi
       ostype:               windows
       initiator:            "{{ WIN_IQN }}"
       hostname:             "{{ PRI_CLU }}"
       username:             "{{ PRI_CLU_USER }}"
       password:             "{{ PRI_CLU_PASS }}"
       https:                true
       validate_certs:       false
    with_items: "{{ igroups }}"
    when: igroups != None
  - name: Create volume
    na_ontap_volume:
       state:           present
       name:            "{{ VOL_NAME }}"
       aggregate_name:  "{{ PRI_AGGR }}"
       size:            "{{ VOL_SIZE }}"
       size_unit:       gb
       space_guarantee: none
       vserver:         "{{ PRI_SVM }}"
       hostname:        "{{ PRI_CLU }}"
       username:        "{{ PRI_CLU_USER }}"
       password:        "{{ PRI_CLU_PASS }}"
       https:           true
       validate_certs:  false
    with_items: "{{ luns }}"
  - name: Lun Create
    na_ontap_lun:
       state:          present
       name:           "{{ LUN_NAME }}"
       flexvol_name:   "{{ VOL_NAME }}"
       vserver:        "{{ PRI_SVM }}"
       size:           "{{ LUN_SIZE }}"
       size_unit:      gb
       ostype:         windows
       space_reserve:  false
       hostname:       "{{ PRI_CLU }}"
       username:       "{{ PRI_CLU_USER }}"
       password:       "{{ PRI_CLU_PASS }}"
       https:          true
       validate_certs: false
    with_items: "{{ luns }}"
    when: luns != None
  - name: Create LUN mapping
    na_ontap_lun_map:
       state:                present
       initiator_group_name: "{{ IGROUP_NAME }}"
       path:                 "/vol/{{ VOL_NAME }}/{{ LUN_NAME }}"
       vserver:              "{{ PRI_SVM }}"
       hostname:             "{{ PRI_CLU }}"
       username:             "{{ PRI_CLU_USER }}"
       password:             "{{ PRI_CLU_PASS }}"
       https:                true
       validate_certs:       false
    with_items: "{{ luns }}"
    when: luns != None
The WUC-cleaned version — what we would run in production
#!/usr/bin/env ansible-playbook
- hosts: localhost
  gather_facts: false

  vars_files:
    - global.vars

  module_defaults:
    group/netapp.ontap.netapp_ontap:
      hostname: "{{ PRI_CLU }}"
      username: "{{ PRI_CLU_USER }}"
      password: "{{ PRI_CLU_PASS }}"
      https: true
      validate_certs: false        # lab certificate - set true in production
      use_rest: always

  tasks:
  - name: Create primary SAN SVM
    netapp.ontap.na_ontap_svm:
      state: present
      name: "{{ PRI_SVM }}"
      comment: "Created with Ansible"
      services:
        iscsi:
          allowed: true

  - name: Enable iSCSI service on the SVM
    netapp.ontap.na_ontap_iscsi:
      state: present
      vserver: "{{ PRI_SVM }}"
      service_state: started

  - name: Create iSCSI data LIF on node01
    netapp.ontap.na_ontap_interface:
      state: present
      vserver: "{{ PRI_SVM }}"
      interface_name: "{{ PRI_SVM }}_iscsi_01"
      address: "{{ PRI_ISCSI_IP }}"
      netmask: "{{ PRI_SVM_NETMASK }}"
      home_node: "{{ PRI_CLU_NODE1 }}"
      home_port: "{{ PRI_DATA_PORT }}"
      service_policy: default-data-iscsi

  - name: Create iSCSI data LIF on node02
    netapp.ontap.na_ontap_interface:
      state: present
      vserver: "{{ PRI_SVM }}"
      interface_name: "{{ PRI_SVM }}_iscsi_02"
      address: "{{ SEC_ISCSI_IP }}"
      netmask: "{{ PRI_SVM_NETMASK }}"
      home_node: "{{ PRI_CLU_NODE2 }}"
      home_port: "{{ PRI_DATA_PORT }}"
      service_policy: default-data-iscsi

  - name: Create initiator group for the Windows host
    netapp.ontap.na_ontap_igroup:
      state: present
      vserver: "{{ PRI_SVM }}"
      name: "{{ IGROUP_NAME }}"
      group_type: iscsi
      os_type: windows
      initiator_names:
        - "{{ WIN_IQN }}"

  - name: Create the volume that will hold the LUN
    netapp.ontap.na_ontap_volume:
      state: present
      vserver: "{{ PRI_SVM }}"
      name: "{{ VOL_NAME }}"
      aggregate_name: "{{ PRI_AGGR }}"
      size: "{{ VOL_SIZE }}"
      size_unit: gb
      space_guarantee: none

  - name: Create the LUN inside the volume
    netapp.ontap.na_ontap_lun:
      state: present
      vserver: "{{ PRI_SVM }}"
      flexvol_name: "{{ VOL_NAME }}"
      name: "{{ LUN_NAME }}"
      size: "{{ LUN_SIZE }}"
      size_unit: gb
      os_type: windows
      space_reserve: false

  - name: Map the LUN to the initiator group
    netapp.ontap.na_ontap_lun_map:
      state: present
      vserver: "{{ PRI_SVM }}"
      path: "/vol/{{ VOL_NAME }}/{{ LUN_NAME }}"
      initiator_group_name: "{{ IGROUP_NAME }}"
The run
[root@centos1 ansible-workshop]# ansible-playbook create_san_all.yml --ask-vault-pass
Vault password:

PLAY [localhost] ***************************************************************

TASK [Create primary SVM] ******************************************************
changed: [localhost]

TASK [Enable iSCSI on primary SVM] *********************************************
changed: [localhost]

TASK [Create iSCSI interface for node01] ***************************************
changed: [localhost]

TASK [Create iSCSI interface for node02] ***************************************
changed: [localhost]

TASK [Create iGroup] ***********************************************************
changed: [localhost] => (item=igroup1)

TASK [Create volume] ***********************************************************
changed: [localhost] => (item=lun1)

TASK [Lun Create] **************************************************************
changed: [localhost] => (item=lun1)

TASK [Create LUN mapping] ******************************************************
changed: [localhost] => (item=lun1)

PLAY RECAP *********************************************************************
localhost    : ok=8    changed=8    unreachable=0    failed=0    skipped=0
What to read in this one. The task order is the dependency stack — tenant → protocol service → network reachability → access control → capacity → LUN → map; shuffle it and ONTAP refuses the forward references. Two LIFs, one per node, is the SAN minimum for path redundancy: Windows MPIO sees both and survives a node takeover. os_type: windows appears on both the igroup and the LUN deliberately (it controls SCSI geometry and alignment), and space_guarantee: none on the volume paired with space_reserve: false on the LUN is the thin-provisioned default — monitor real usage, as in the performance playbook. After the run, the Windows host needs only an iSCSI target portal pointed at either LIF IP, then a rescan.
Three differences, each a habit worth keeping. Credentials: the original’s first four tasks use the &input anchor but the last four repeat hostname/username/password longhand — the cleaned version uses module_defaults for the whole collection, so no task can drift or forget them. LIF parameters: the original’s role: data + firewall_policy: data are older interface fields, which is why its use_rest line is commented out; the REST-native replacement is a single service_policy: default-data-iscsi, and with it the playbook runs cleanly with use_rest: always. Accidental loops: with_items: "{{ igroups }}" with when: != None iterates a single string — harmless here, but for one resource write one task and reserve loop: for real lists. The cleaned version produces the identical cluster state; it just ages without breaking.
Data protection
Set up cross-cluster SnapMirror replication
Job: replicate a volume from one cluster to another for disaster recovery — peer the clusters, peer the SVMs, create the destination, and establish the SnapMirror relationship. Modules: na_ontap_cluster_peer, na_ontap_vserver_peer, na_ontap_volume (type DP), na_ontap_snapmirror. File: snapmirror-create.yml.
The lab original — exactly as it runs in the workshop
---
- hosts: localhost
  name: Snapmirror Create
  gather_facts: false
  vars:
    src_ontap:   192.168.0.101
    src_lif:     192.168.0.120,192.168.0.121
    src_vserver: svm1
    src_volume:  vol1
    dst_ontap:   192.168.0.102
    dst_name:    cluster2
    dst_lif:     192.168.0.122
    dst_aggr:    aggr1_cluster2_01_data
    dst_vserver: svm2
    dst_volume:  vol1_sm
    username:    admin            # !! plaintext credentials in the playbook
    password:    Netapp1!         # !! - see the security note below
    passphrase:  Netapp123        # !!
  tasks:
  - name: Create cluster peer
    na_ontap_cluster_peer:
      state: present
      source_intercluster_lifs: "{{ src_lif }}"
      dest_intercluster_lifs:   "{{ dst_lif }}"
      passphrase:    "{{ passphrase }}"
      hostname:      "{{ src_ontap }}"
      dest_hostname: "{{ dst_ontap }}"
      username:      "{{ username }}"
      password:      "{{ password }}"
      https: true
      validate_certs: false
  - name: sleep for 20 seconds and continue with play
    wait_for:
      timeout: 20
    delegate_to: localhost
  - name: Source vserver peer create
    na_ontap_vserver_peer:
      state: present
      peer_vserver: "{{ dst_vserver }}"
      peer_cluster: "{{ dst_name }}"
      vserver:      "{{ src_vserver }}"
      applications: snapmirror
      hostname:      "{{ src_ontap }}"
      dest_hostname: "{{ dst_ontap }}"
      username: "{{ username }}"
      password: "{{ password }}"
      https: true
      validate_certs: false
  - name: sleep for 20 seconds and continue with play
    wait_for:
      timeout: 20
    delegate_to: localhost
  - name: Validate destination FlexVol
    na_ontap_volume:
      state: present
      name:           "{{ dst_volume }}"
      aggregate_name: "{{ dst_aggr }}"
      size: 1
      size_unit: gb
      type: DP
      vserver:  "{{ dst_vserver }}"
      hostname: "{{ dst_ontap }}"
      username: "{{ username }}"
      password: "{{ password }}"
      https: true
      validate_certs: false
  - name: Create SnapMirror
    na_ontap_snapmirror:
      state: present
      source_volume:       "{{ src_volume }}"
      destination_volume:  "{{ dst_volume }}"
      source_vserver:      "{{ src_vserver }}"
      destination_vserver: "{{ dst_vserver }}"
      hostname: "{{ dst_ontap }}"
      username: "{{ username }}"
      password: "{{ password }}"
      https: true
      validate_certs: false
The WUC-cleaned version — what we would run in production
#!/usr/bin/env ansible-playbook
- hosts: localhost
  gather_facts: false

  vars_files:
    - global.vars            # ALL credentials live here, vault-encrypted

  module_defaults:
    group/netapp.ontap.netapp_ontap:
      username: "{{ PRI_CLU_USER }}"   # same admin on both clusters here;
      password: "{{ PRI_CLU_PASS }}"   # use SEC_CLU_* if they differ
      https: true
      validate_certs: false            # lab certificate - true in production
      use_rest: always

  tasks:
  - name: Peer the two clusters
    netapp.ontap.na_ontap_cluster_peer:
      state: present
      hostname: "{{ PRI_CLU }}"
      dest_hostname: "{{ SEC_CLU }}"
      source_intercluster_lifs: "{{ PRI_CLU_IC1_IP }},{{ PRI_CLU_IC2_IP }}"
      dest_intercluster_lifs: "{{ SEC_CLU_IC1_IP }}"
      passphrase: "{{ peer_passphrase }}"   # vaulted, not literal

  - name: Peer the source and destination SVMs for snapmirror
    netapp.ontap.na_ontap_vserver_peer:
      state: present
      hostname: "{{ PRI_CLU }}"
      dest_hostname: "{{ SEC_CLU }}"
      vserver: "{{ PRI_SVM }}"
      peer_vserver: "{{ SEC_SVM }}"
      peer_cluster: "{{ SEC_CLU_NAME }}"
      applications: snapmirror

  - name: Create the destination DP volume
    netapp.ontap.na_ontap_volume:
      state: present
      hostname: "{{ SEC_CLU }}"
      vserver: "{{ SEC_SVM }}"
      name: "{{ dst_volume }}"
      aggregate_name: "{{ SEC_AGGR }}"
      size: 1
      size_unit: gb
      type: DP                 # data-protection destination - no junction path

  - name: Establish and initialize the SnapMirror relationship
    netapp.ontap.na_ontap_snapmirror:
      state: present
      hostname: "{{ SEC_CLU }}"        # snapmirror is driven from the destination
      source_endpoint:
        path: "{{ PRI_SVM }}:{{ src_volume }}"
      destination_endpoint:
        path: "{{ SEC_SVM }}:{{ dst_volume }}"
      policy: MirrorAllSnapshots
      initialize: true
The run
[root@centos1 ansible-workshop]# ansible-playbook snapmirror-create.yml --ask-vault-pass
Vault password:

PLAY [Snapmirror Create] *******************************************************

TASK [Create cluster peer] *****************************************************
changed: [localhost]

TASK [sleep for 20 seconds and continue with play] ****************************
ok: [localhost]

TASK [Source vserver peer create] *********************************************
changed: [localhost]

TASK [sleep for 20 seconds and continue with play] ****************************
ok: [localhost]

TASK [Validate destination FlexVol] *******************************************
changed: [localhost]

TASK [Create SnapMirror] *******************************************************
changed: [localhost]

PLAY RECAP *********************************************************************
localhost    : ok=6    changed=4    unreachable=0    failed=0    skipped=0
What to read in this one. SnapMirror has a four-step dependency chain and the order is mandatory: cluster peer (the two clusters authenticate to each other with a shared passphrase) → SVM peer (the two SVMs authorize SnapMirror traffic between them) → destination volume (created as type: DP — a data-protection volume that is read-only and takes no junction path, because it exists only to receive replicated data) → the relationship itself, which is driven from the destination cluster (note every snapmirror task targets dst_ontap/SEC_CLU as its hostname). The relationship pulls from source to destination; the destination is in charge. initialize: true performs the first full baseline transfer.
The security fix is the headline. The lab original declares username: admin, password: Netapp1!, and a cluster-peer passphrase: Netapp123 as plaintext literals in the playbook’s own vars block — committed to the repository, visible in every clone, exactly the failure Ansible Vault exists to prevent. The cleaned version moves all three into the vault-encrypted global.vars (the passphrase as peer_passphrase) and supplies the shared credentials once via module_defaults. Nothing secret remains in the playbook. Two correctness notes. The wait_for: timeout “sleep” tasks are a fragile timing hack — peering usually propagates in seconds, but a fixed 20-second sleep both wastes time when it is ready sooner and fails when it is not; the production pattern is a retries/until loop that polls the peer state, though a short sleep is tolerable for a lab. And the modern na_ontap_snapmirror uses source_endpoint/destination_endpoint path syntax rather than the older flat source_volume/destination_volume fields — both work, the endpoint form is current. The dependency order and the destination-driven model are correct in the original and kept exactly.
Enterprise automation scenarios
The fourteen examples above are building blocks. What follows is how storage teams actually compose them in production — the patterns that turn a folder of playbooks into an operating model. Each scenario names the modules involved and the principle that makes it scale.
Automated storage provisioning at scale
The problem. A project needs forty volumes with consistent naming, size, and export policy. Created by hand in System Manager, that is forty opportunities for a typo and no record of intent. The pattern: declare the volumes as data and let one task loop over them — the list is the documentation, and the diff when you add the forty-first volume is your change record.
  tasks:
  - name: Provision the project volumes from a declared list
    netapp.ontap.na_ontap_volume:
      state: present
      vserver: "{{ PRI_SVM }}"
      name: "{{ item.name }}"
      aggregate_name: "{{ item.aggr | default(PRI_AGGR) }}"
      size: "{{ item.size }}"
      size_unit: gb
      junction_path: "/{{ item.name }}"
      export_policy: "{{ item.policy | default('default') }}"
      space_guarantee: none
      comment: "Project volume - managed by Ansible"
    loop:
      - { name: proj_data_01, size: 500 }
      - { name: proj_data_02, size: 500 }
      - { name: proj_logs_01, size: 100, policy: restricted }
      # ... extend the list; one line per volume, reviewed in Git
Scaling further, the list moves out of the playbook entirely — into a group_vars file, a CSV the team edits, or a CMDB query — and the same task provisions any number of volumes. The module’s idempotency means re-running after adding entries touches only the new volumes. Modules: na_ontap_volume, often preceded by na_ontap_aggregate when capacity pools are provisioned in the same run.
VMware datastore deployment
The problem. Standing up vSphere datastores means provisioning storage that ESXi can consume — an NFS export the hosts mount, or an iSCSI LUN they claim — and doing it identically across a cluster of hosts. The pattern: the NAS and SAN examples in this guide are the storage half; the playbook provisions the volume and the access layer (export policy scoped to the ESXi management network for NFS, or a LUN mapped to an igroup of the hosts’ IQNs for iSCSI/VMFS), and the vSphere side is automated separately with the community.vmware collection. The two run in one pipeline: ONTAP provisions, vCenter mounts. Modules: na_ontap_volume, na_ontap_export_policy (NFS datastores) or na_ontap_lun + na_ontap_igroup + na_ontap_lun_map (VMFS), with the ESXi management subnet as the client_match or the hosts’ IQNs as the igroup initiators.
Multi-tenant SVM automation
The problem. Onboarding a new customer or department means a repeatable bundle: an SVM, its network identity, DNS, a route, the protocols they bought, and a starter volume — identical every time, auditable, and deletable as a unit. The pattern: the section-10 examples are exactly this bundle. Wrap them in a role (or a single playbook driven by per-tenant variables) and onboarding becomes one command with one vars file; the tenant’s entire definition lives in version control.
Figure 02 · Multi-tenant SVM provisioning from one parameterized playbook
state: absent offboards one cleanly.Disaster recovery automation
The problem. DR is only real if it is tested, and manual SnapMirror failover is too error-prone to test often. The pattern: the SnapMirror example (70-01) establishes replication as code; the same collection orchestrates the failover and the periodic test. A DR runbook becomes a playbook: quiesce and break the relationship to activate the destination, or in a test, clone the destination and verify the data without disturbing replication. Because the relationship is declared, drift in the protection topology is detectable on a schedule.
Figure 03 · SnapMirror disaster-recovery workflow
Storage-as-Code
The principle. Everything above shares one idea: the cluster’s configuration lives in Git, not in an administrator’s memory or a wiki page that drifts. Playbooks, inventory, and the (vault-encrypted) variables are version-controlled; changes go through pull requests and review; a bad change rolls back with a revert instead of an archaeology session. The repository becomes the most accurate description of the estate that exists — and because the playbooks are idempotent, that description is enforceable, not just documentary. This is the difference between automation and Storage-as-Code: automation runs commands faster, Storage-as-Code makes the desired state auditable and self-correcting.
Day-2 operations
The principle. Provisioning is day one; the value compounds on day two. Routine administration — growing a volume, rotating snapshots, standardizing a snapshot policy across a fleet, adding an export rule, reading performance — all become small, reviewable, repeatable playbooks. A snapshot policy applied through na_ontap_snapshot_policy is identical on every volume because the same code created it; a capacity increase is a one-line diff with an audit trail. The read-only na_ontap_rest_info turns into a nightly reporting and drift-detection job. Day-2 is where the discipline pays for itself, because the work that used to be a hundred manual clicks per week becomes a scheduled pipeline nobody has to remember.
ONTAP automation in CI/CD pipelines
The natural home for these playbooks is a pipeline, not an engineer’s laptop. Committing a change to the storage repository triggers the same sequence every enterprise CI/CD system supports: lint and syntax-check the YAML, run the playbook in --check mode against the cluster to preview changes without making them, require an approval, then apply. The vault password comes from the pipeline’s secret store (never the repo), and every run is logged with who triggered it and what changed.
Figure 04 · CI/CD pipeline driving ONTAP automation
--check stage and approval gate are what make applying storage changes from a pipeline safe.Concretely, the apply stage runs ansible-playbook site.yml --vault-password-file "$VAULT_PASS_FILE", where the runner writes the vault password to a short-lived file from its secret store and deletes it afterward. The --check stage runs the identical command with --check --diff and posts the would-change output to the merge request, so reviewers approve a concrete plan, not a hope. This is the production form of the discipline every cleaned playbook in this guide is written for.
Troubleshooting ONTAP Ansible automation
Nearly every failure in the first month of running these playbooks falls into one of five buckets. Each announces itself with a recognizable message; match the symptom and apply the fix.
Authentication and RBAC failures
| Symptom | Root cause | Resolution |
|---|---|---|
401 Unauthorized / Invalid credentials |
Wrong username or password, or the wrong cluster hostname | Verify the vaulted PRI_CLU_USER / PRI_CLU_PASS against a manual login; confirm hostname is the cluster management LIF, not a node or data LIF. |
403 Forbidden on a specific resource |
The account authenticates but its role lacks rights to that API | The automation account needs a role with access to the relevant REST endpoints. Use a dedicated admin-scoped account, or a custom role granting only the API paths your playbooks touch — least privilege, but sufficient. |
User is not authorized for http application |
The account exists but the http application is not enabled for it |
The REST API requires the user to have the http (and typically ontapi) application enabled. Confirm with security login show; the automation account must be permitted to authenticate over HTTP. |
The durable fix is a purpose-built automation account: a dedicated cluster user, http-enabled, with a role scoped to what the playbooks actually do, and its password in the vault. Never automate as the same interactive admin a human logs in with — you want the audit log to distinguish “the pipeline did this” from “a person did this.”
TLS and certificate issues
The single most common line to get wrong is validate_certs. Every lab original in this guide sets validate_certs: false because lab clusters ship with self-signed certificates and verification would fail. That setting is a lab convenience and a production liability: with verification off, anything that can intercept the HTTPS session can impersonate the cluster and harvest the admin credential the playbook sends. The production fix is not to keep disabling it — it is to install a CA-signed (or trusted internal-CA) certificate on the cluster management LIF and set validate_certs: true. If you must run against a self-signed certificate temporarily, treat validate_certs: false the way you treat any other security exception: scoped to one environment, documented, and never copied into the production vars file. Symptoms to expect: SSL: CERTIFICATE_VERIFY_FAILED means verification is on and the certificate is not trusted — the right answer is to fix the trust, not to disable the check.
Connectivity problems
Before suspecting Ansible, prove the layer beneath it. A module that hangs or times out is almost always a network problem, not a code problem. Check, in order: DNS — can the control node resolve the cluster management name? (nslookup cluster1.demo.netapp.com); reachability — does curl -k https://cluster1.demo.netapp.com/api/cluster return JSON, or hang? A hang is a firewall or routing problem between the control node and the management LIF on port 443; the management LIF itself — is it up and is the cluster healthy? The control node needs HTTPS (443) to the cluster management LIF specifically; reaching a node management or data LIF is not the same thing. This is the same layer-isolation discipline that applies to the per-SVM DNS and routing examples earlier — fix the network below before debugging the automation above.
Common REST API errors
| Message pattern | Root cause | Resolution |
|---|---|---|
job reported error ... duplicate entry / already exists |
A non-idempotent parameter, or creating something that exists with different immutable attributes | Most modules are idempotent; this usually means an immutable field (an aggregate, a security style) differs from the existing object. Read current state with na_ontap_rest_info and reconcile, rather than forcing. |
svm not found / aggregate not found |
A dependency does not exist, or a name differs between vars and cluster | Check the dependency order — SVM before its volumes, CIFS server before its shares — and verify the name in global.vars matches the cluster exactly. Names are the most common drift between lab and production. |
missing required arguments |
A required parameter is unset, often an empty variable | A variable referenced in the playbook is empty or undefined in global.vars. Run with --check first; it surfaces undefined-variable errors before any change is attempted. |
ModuleNotFoundError before any API call |
The collection or a Python library is missing from Ansible’s environment | Install the collection (ansible-galaxy collection install netapp.ontap) and netapp-lib into the same environment Ansible runs from. See the install guide’s storage extras. |
Playbook debugging technique
Three tools resolve almost everything the tables above do not. Verbosity: re-run with -vvv to see the exact REST calls, request bodies, and responses — the response JSON usually names the real problem precisely. Add no_log: true to credential-bearing tasks first, so verbose output does not echo secrets into logs. Check and diff: --check --diff previews what would change without changing it — the safest first run against any cluster and the fastest way to catch undefined variables and bad parameter names. Read the truth: when a module’s behavior is surprising, query actual cluster state with na_ontap_rest_info and a targeted gather_subset — comparing what Ansible thinks exists against what the cluster reports resolves most “it should have worked” cases. The pattern is always the same: isolate the layer (network, then auth, then the module’s view of state) before changing the playbook.
Production lessons from the field
Vendor documentation tells you what the modules do. This is what running them across enterprise estates teaches — the things that are obvious only in hindsight.
Lessons learned. The playbook is never the hard part; the operating model around it is. Teams that succeed treat inventory and playbooks as production code — reviewed, versioned, pipeline-applied — from day one, not as scripts that graduate to that later. The ones that struggle started with ansible as “a faster way to type CLI commands” and never made the leap to desired-state thinking. The single highest-leverage habit is wiring a nightly --check run early: it converts your playbooks from provisioning tools into a continuous drift-detection system, and it surfaces the gap between documented and actual state before an auditor does.
Common mistakes. Five recur across nearly every estate. Disabling certificate validation in production and forgetting it was ever temporary. Hard-coding credentials in playbooks or vars files instead of the vault — the single most common security finding. Specifying sizes in raw bytes where a one-digit typo is a 10× error no reviewer catches (use size + size_unit, always). Granting wildcard permissions — FullAccess S3 policies, any NFS rules — because the lab example did. And mixing imperative habits into declarative code: writing a task per object instead of looping a declared list, or assuming order where idempotency makes it irrelevant.
Scaling considerations. What works for one cluster needs structure for fifty. Move per-cluster facts into group_vars and host_vars rather than a single global.vars; the playbooks stay identical and only the variable scope changes. Use dynamic inventory sourced from na_ontap_rest_info or a CMDB so the fleet is discovered, not hand-listed. Pin the collection version in requirements.yml so every control node and pipeline runner behaves identically — an unpinned collection is how “works on my machine” enters storage automation. And separate vault passwords per environment, so a compromised lab credential cannot decrypt production.
Security best practices. A dedicated, http-enabled automation account with a least-privilege role, never the interactive admin. All secrets in Ansible Vault, the vault password in a secrets manager or pipeline store, never in Git. validate_certs: true against a real certificate in production. no_log: true on every task that handles a credential. Scoped permissions everywhere the lab used wildcards — named S3 policies, CIDR-scoped NFS rules, igroups treated like firewall rules. The recurring theme across this entire reference is that lab-convenient defaults are audit findings; production automation closes each one deliberately.
Operational runbooks. The endgame is that routine storage work stops being interactive. A volume-growth request is a one-line pull request, not a console session. A new-tenant onboarding is a vars file and a pipeline run. A DR test is a scheduled playbook that clones the destination and validates it. A quarterly access review reads live state with na_ontap_rest_info and diffs it against the declared policies. Each of these is a runbook that used to live in a human’s head or a stale wiki; as code, it is executable, reviewable, and the same every time it runs. That is the operating model WUC builds into the estates we run — and the reason these fourteen examples are written for production from the first line, not retrofitted to it later.
The recurring lesson: lab-convenient is audit-findable
Read these fourteen examples together and one pattern repeats across every protocol. The lab originals are written for a closed training environment, so they reach for the convenient default — and almost every convenient default is a finding in a production audit. Four show it plainly. The S3 policy in 50-02 grants actions: ["*"] on resources: ["*"] — full access by another name. The NFS rule in 30-03 sets ro_rule: any / rw_rule: any — unauthenticated read-write to anyone on the subnet. The SnapMirror playbook in 70-01 hard-codes the cluster password and peering passphrase as plaintext in the playbook itself. And nearly every original disables certificate validation and repeats credentials in the clear.
The cleaned versions apply the same three corrections every time: scope the permission (named actions and resources, specific client networks, least-privilege policies), encrypt the secret (everything sensitive in a vault-encrypted global.vars, supplied once through module_defaults), and state intent explicitly (descriptive policy IDs, real comments, units a reviewer can verify at a glance). None of this changes what the playbook builds; all of it changes whether the playbook survives review. That is the whole difference between a script that works in a lab and one that runs in production — and it is the discipline WUC builds into every estate we automate.
Using this reference
Find the job in the build-order list, copy the blue block, change the variables in your global.vars, and run it with ansible-playbook <file>.yml --ask-vault-pass. The examples are deliberately ordered by dependency — an SVM before its volumes, a volume before its shares, a CIFS server before an SMB share — so reading top to bottom is also a working build sequence for a complete storage service. Every cleaned playbook is idempotent: run it twice and the second run reports changed=0, which is how you turn any of these into a scheduled compliance check. For the concepts underneath — how the modules reach the cluster, what makes them safe to re-run, and how Vault protects the credentials — the three field guides linked throughout are the place to start.
Automating a NetApp estate beyond the lab?
These fourteen playbooks are the building blocks; an automated estate is the operating model around them — vault discipline, least-privilege service accounts, change-controlled pipelines, and drift enforcement that runs on a schedule. WUC engineers build and run both, across NetApp ONTAP, Cisco fabrics, and multi-OEM infrastructure, as an automation consultant, maintenance provider, and managed services partner.
Prefer to read first? See managed services and post-OEM storage maintenance.
References
- Ansible project. netapp.ontap collection documentation. The authoritative reference for every module used across these fourteen examples.
- Ansible Galaxy. netapp.ontap role: na_ontap_nas_create. NetApp’s prebuilt role packaging the volume-to-share NAS flow — the consume-rather-than-compose option once these building blocks are familiar.
- NetApp. ONTAP Automation Documentation. The REST API foundation every module here drives.
- WUC Technologies. How to Install Ansible, NetApp ONTAP Ansible Playbooks, and Encrypting Ansible Variables with Ansible Vault. The three field guides this reference accompanies.
Find our field guides faster in Google. Add WUC Technologies as a preferred source and our engineering guides carry a “preferred” badge in your Search results, AI Overviews, and AI Mode.
Encrypting Ansible Variables with Ansible Vault: A Real Walkthrough, Including the First Error You Will Hit
There is a moment in every engineer’s first week with Ansible when the tooling stops being theoretical: you encrypt your variables file, run the playbook the way you always have, and Ansible answers with ERROR! Attempting to decrypt but no vault secrets found. It reads like something broke. Nothing broke. That error is Ansible Vault doing precisely its job — and the engineers who understand why it appears handle secrets correctly for the rest of their careers.
This walkthrough is taken from a real session on a CentOS control node in a NetApp ONTAP automation lab: a variables file holding two clusters’ worth of credentials, the encryption, the error, the fix, and the day-2 commands that keep plaintext off disk permanently. It assumes the setup from our Ansible installation guide and pairs with the ONTAP playbooks guide, where Vault protects every playbook’s credentials.
Encrypting an Ansible variables file with ansible-vault encrypt, proving the encryption took, understanding and fixing the no vault secrets found error, the view/edit/rekey lifecycle that never leaves plaintext on disk, the ansible.cfg setup that removes the password prompt, and the honest limits of what Vault protects.
Audience: engineers securing their first automation credentials. Examples use a NetApp lab environment; the pattern applies to any Ansible estate.
The problem Vault solves, in one sentence
Your playbooks belong in Git — that is where review, history, and rollback come from — but your passwords must never be in Git, and a variables file is how both statements stay true at once: playbooks reference "{{ PRI_CLU_PASS }}" in the clear, the file defining it is encrypted with AES-256, and the decryption key arrives only at runtime. Ansible Vault is the encryption half of that bargain — a subcommand suite (ansible-vault encrypt / view / edit / rekey) that turns YAML files into ciphertext Ansible can transparently decrypt in memory during a run.
The variables file we are protecting
The file in this session, global.vars, is the environment model for a two-cluster NetApp lab — the single place where every site-specific fact lives so the playbooks themselves never change between environments. Here it is in full, because the inventory of what needs protecting is the point:
$ cat global.vars
{
        "PRI_CLU":              "cluster1.demo.netapp.com",
        "PRI_CLU_USER":         "admin",
        "PRI_CLU_PASS":         "Netapp1!",
        "PRI_CLU_NODE1":        "cluster1-01",
        "PRI_CLU_NODE2":        "cluster1-02",
        "PRI_MGMT_PORT":        "e0c",
        "PRI_DATA_PORT":        "e0d",
        "PRI_SVM":              "san_svm",
        "PRI_SVM2":             "svm_san",
        "PRI_SVM_IP":           "192.168.0.200",
        "PRI_SVM_NETMASK":      "255.255.255.0",
        "PRI_SVM_CIFS_IP":      "192.168.0.201",
        "PRI_SVM_CIFS_NETMASK": "255.255.255.0",
        "PRI_SVM_NFS_IP":       "192.168.0.202",
        "PRI_SVM_NFS_NETMASK":  "255.255.255.0",
        "PRI_CLU_IC1_IP":       "192.168.0.121",
        "PRI_CLU_IC2_IP":       "192.168.0.122",
        "PRI_CLU_IC_NETMASK":   "255.255.255.0",
        "PRI_CLU_DEFAULT_GW":   "192.168.0.1",
        "PRI_AGGR":             "aggr1_cluster1_01_data",
        "PERF_AGGR":            "aggr1_cluster1_01_data",
        "PRI_AGGR_02":          "aggr1_cluster1_02_data",
        "PRI_DOMAIN":           "demo.netapp.com",
        "PRI_DNS1":             "192.168.0.253",
        "PRI_DNS2":             "",
        "PRI_AD_DOMAIN":        "demo.netapp.com",
        "PRI_AD_USER":          "Administrator@demo.netapp.com",
        "PRI_AD_PASS":          "Netapp1!",
        "VOL_SIZE":             "20",
        "SEC_CLU":              "cluster2.demo.netapp.com",
        "SEC_CLU_USER":         "admin",
        "SEC_CLU_PASS":         "Netapp1!",
        "SEC_CLU_NODE1":        "cluster2-01",
        "SEC_CLU_NODE2":        "",
        "SEC_MGMT_PORT":        "e0c",
        "SEC_DATA_PORT":        "e0d",
        "SEC_SVM":              "sec_svm_01",
        "SEC_SVM_IP":           "192.168.0.210",
        "SEC_SVM_NETMASK":      "255.255.255.0",
        "SEC_AGGR":             "aggr1_cluster2_01_data",
        "SEC_DOMAIN":           "demo.netapp.com",
        "SEC_DNS1":             "192.168.0.253",
        "SEC_DNS2":             "",
        "SEC_AD_DOMAIN":        "demo.netapp.com",
        "SEC_AD_USER":          "Administrator@demo.netapp.com",
        "SEC_AD_PASS":          "Netapp1!",
        "SEC_SVM_CIFS_IP":      "192.168.0.211",
        "SEC_SVM_CIFS_NETMASK": "255.255.255.0",
        "SEC_SVM_NFS_IP":       "192.168.0.212",
        "SEC_SVM_NFS_NETMASK":  "255.255.255.0",
        "SEC_CLU_IC1_IP":       "192.168.0.123",
        "SEC_CLU_IC2_IP":       "",
        "SEC_CLU_IC_NETMASK":   "255.255.255.0",
        "SEC_CLU_DEFAULT_GW":   "192.168.0.1",
        "VOL_NAME": "san_vol",
        "WIN_IQN": "iqn.1991-05.com.microsoft:jumphost.demo.netapp.com",
        "LUN_NAME": "lun1",
        "IGROUP_NAME": "igroup1",
        "PRI_ISCSI_IP": "192.168.0.241",
        "SEC_ISCSI_IP": "192.168.0.242",
        "LUN_SIZE": "5",
        "igroups": "igroup1",
        "luns": "lun1",
        "vol_name": "san_vol"
}
Four things to notice before encrypting. First, the inventory of secrets is bigger than a skim suggests: this one file holds admin passwords for two clusters plus the Active Directory join account for both — anyone who reads it owns the storage estate and has a foothold in the domain; the netmasks and port names around them are harmless, but the file encrypts as a unit. Second, the JSON-style formatting works because Ansible parses vars_files as YAML, and YAML accepts quoted-key flow mappings — keep quoting consistent, because a value like Administrator@demo.netapp.com left unquoted parses fine as YAML while breaking any strict JSON tool a colleague later points at the file. Third, the duplicate keys in different cases at the bottom (VOL_NAME and vol_name, IGROUP_NAME and igroups) are deliberate: Ansible variables are case-sensitive, and the lowercase names match the variable interface of NetApp’s prebuilt Galaxy roles while the uppercase ones feed the workshop’s own playbooks — one file serving two naming conventions. Fourth, if your repository splits variables across several files, inventory every file holding a secret before you start — encrypting one and forgetting its sibling protects nothing, and ansible-vault encrypt happily takes multiple filenames in one command. Lab passwords like these are published in every workshop guide; encrypting them is practice for the day the file holds real ones, which is exactly what practice is for.
Sidebar: that first line, #!/usr/bin/env ansible-playbook
The lab’s playbooks open with a shebang, which deserves thirty seconds because it confuses everyone once. #! is the Unix convention telling the kernel which interpreter runs a file when you execute it directly; /usr/bin/env ansible-playbook means “find ansible-playbook on this machine’s PATH” — portable across pipx, pip, and yum installs, whose binary locations all differ. The effect after a one-time chmod +x:
# both forms run the same playbook; the shebang enables the second
ansible-playbook 21_create_pri_svm.yml
./21_create_pri_svm.yml
To YAML the line is just a comment, so it never affects parsing, and every flag you are about to learn passes through the ./ form unchanged. Teams typically keep the explicit form in CI (execute bits do not always survive checkouts) and enjoy the short form on jump hosts.
Step 1 — encrypt the file
One command, two prompts, and the plaintext era of this file is over:
ansible-vault encrypt global.vars

# prove it took - the first line of the file is now a vault header
head -1 global.vars

# repos that split variables across several files: one command covers them all
# ansible-vault encrypt global.vars other_env.vars
[root@centos1 ansible-workshop]# ansible-vault encrypt global.vars
New Vault password:
Confirm New Vault password:
Encryption successful

[root@centos1 ansible-workshop]# head -1 global.vars
$ANSIBLE_VAULT;1.1;AES256

[root@centos1 ansible-workshop]# cat global.vars
$ANSIBLE_VAULT;1.1;AES256
6638643965323633646262656665306333616466396630323136393465356136
3964363833313662643162653630353037633634383265653730363231343336
...
The vault password you typed at those prompts is a new secret you just created — it is not the cluster password, it is the key that unlocks the file, and it now needs a home (a password manager entry, or your CI system’s secret store). What Git, backups, and anyone who copies the repository see from this moment on is the ciphertext: the $ANSIBLE_VAULT;1.1;AES256 header followed by hex. Even git diff reveals nothing but new ciphertext when values change. Critically, the playbook needs zero edits — vars_files: - global.vars and every "{{ PRI_CLU_PASS }}" reference stay exactly as they were.
Step 2 — hit the error (everyone does)
The playbook under test is the lab’s volume–qtree–share trio, named for what it does: create_vol_qtree_share.yml. It is worth seeing in full, because it demonstrates the point of the whole exercise — every credential is a variable reference, the anchored &input connection block is reused by all three tasks via the <<: *input merge key, and nothing in this file changed when the vars file was encrypted:
#!/usr/bin/env ansible-playbook
- hosts: localhost
  gather_facts: false
  vars:
    input: &input
      hostname:       "{{ PRI_CLU }}"
      username:       "{{ PRI_CLU_USER }}"
      password:       "{{ PRI_CLU_PASS }}"   # still just a variable reference -
                                             # Ansible decrypts the file in memory
                                             # and this resolves like any other var
      https:          true
      validate_certs: false
      use_rest:       Always
  vars_files:
    - global.vars                        # now AES-256 ciphertext on disk -
                                             # same line, no change needed
  collections:
    - netapp.ontap
  tasks:
  - name: Create volume
    na_ontap_volume:
      name: "{{ PRI_SVM }}_cifs_01"
      state:                 present
      aggregate_name: "{{ PRI_AGGR }}"
      size: "{{ VOL_SIZE }}"
      size_unit: mb
      vserver: "{{ PRI_SVM }}"
      junction_path: "/{{ PRI_SVM }}_cifs_01"
      volume_security_style: ntfs
      policy: default
      <<: *input
  - name : Create Qtree
    na_ontap_qtree:
      state: present
      name: "cifs_01"
      flexvol_name: "{{ PRI_SVM }}_cifs_01"
      vserver: "{{ PRI_SVM }}"
      security_style: ntfs
      <<: *input
  - name : Create share
    na_ontap_cifs:
      state: present
      name: "share_01"
      vserver: "{{ PRI_SVM }}"
      path: "/{{ PRI_SVM }}_cifs_01"
      <<: *input
Now run it the way muscle memory says to — here with --check, previewing changes without making them:
[root@centos1 ansible-workshop]# ansible-playbook create_vol_qtree_share.yml --check
ERROR! Attempting to decrypt but no vault secrets found
[root@centos1 ansible-workshop]#
Read the message precisely, because it says less than panic hears. It does not say the vault is corrupt, the password is wrong, or the file is damaged. It says: this run was handed zero vault passwords to try. Ansible loaded vars_files, met the $ANSIBLE_VAULT header, had no key to attempt, and stopped before touching anything — which is the entire security model working. The instinct this error must never trigger is ansible-vault decrypt “to get unblocked”: that re-writes the plaintext to disk and undoes the exercise. The file is fine. The command was incomplete.
Step 3 — run with the vault flag
ansible-playbook create_vol_qtree_share.yml --check --ask-vault-pass
[root@centos1 ansible-workshop]# ansible-playbook create_vol_qtree_share.yml --check --ask-vault-pass
Vault password:

PLAY [Create volume, qtree, and share] *****************************************

TASK [Create volume] ***********************************************************
changed: [localhost]

TASK [Create Qtree] ************************************************************
changed: [localhost]

TASK [Create share] ************************************************************
changed: [localhost]

PLAY RECAP *********************************************************************
localhost    : ok=3    changed=3    unreachable=0    failed=0    skipped=0
One flag, one prompt, and the run proceeds exactly as it did before encryption — decryption happens in memory, the variables resolve, and nothing decrypted is written back to disk. Note that --check and --ask-vault-pass compose naturally: a vaulted dress rehearsal is the right first run after any change. And keep the two similarly shaped flags straight, because a playbook can legitimately need both: --ask-vault-pass decrypts your files on the control node; --ask-become-pass is sudo on managed nodes. Same shape, different doors.
Figure 01 · The complete lifecycle — where the password is plaintext, and where it never is
Day-2 operations: view, edit, rekey — never decrypt
Everything you will routinely need, none of which leaves plaintext on disk:
# read the values without decrypting the file
ansible-vault view global.vars

# change values: opens decrypted in $EDITOR, re-encrypts on save
ansible-vault edit global.vars

# change the vault password itself (e.g. after a team departure)
ansible-vault rekey global.vars
The subcommand to treat as radioactive is ansible-vault decrypt — it has exactly one legitimate use (permanently un-vaulting a file that no longer needs protection) and one common misuse (working around the no vault secrets found error, which re-exposes every secret the encryption existed to protect). If you find yourself typing decrypt to make an error go away, the answer was a flag, not a key ceremony. For any value change or consistency cleanup, edit is the tool: the change happens inside the vault, and the file never exists decrypted on disk.
Removing the prompt: ansible.cfg and a password file
Typing the vault password every run is correct for production change windows and tedious for a lab. The standing configuration — three commands, run once in the project directory:
cat > ansible.cfg <<'EOF'
[defaults]
vault_password_file = /root/.vault_pass
EOF

echo 'YourVaultPassword' > /root/.vault_pass
chmod 600 /root/.vault_pass
After this, plain ansible-playbook create_vol_qtree_share.yml --check works with no flag — Ansible finds ansible.cfg in the current directory and reads the password file automatically (the ANSIBLE_VAULT_PASSWORD_FILE environment variable does the same per-shell). The honest accounting: you have moved the secret from prompt to file, so the file’s protection is now the control — chmod 600, owned by the automation user, never committed to Git, and in CI written at job start from the pipeline’s secret store rather than living on the runner. For estates with multiple vaults, the newer --vault-id label@source syntax labels which password unlocks which files; file that away for the day you meet it in someone else’s repository.
What Vault does not solve
Vault relocates the secret problem; it does not eliminate it. You traded “credentials readable in every clone of the repository” for “one vault password to protect” — an excellent trade, but that password still needs a managed home, and three residual exposures deserve names. Verbose logging: a task that passes credentials as module parameters can echo them into logs under -vvv; add no_log: true to such tasks before any CI pipeline runs them. Memory during the run: decrypted values exist in the Ansible process while it executes — on a shared control node, control-node hygiene is part of the security boundary. The blast radius of one password: if every environment shares one vault password, every environment falls together; per-environment vault IDs are the production-grade refinement. None of this argues against Vault — it argues for knowing precisely what the tool promised, which was encryption at rest, delivered completely.
Frequently asked questions
Q01
What does “Attempting to decrypt but no vault secrets found” mean?
Your run referenced a vault-encrypted file but supplied no vault password for Ansible to try — nothing is broken or corrupted. Re-run with --ask-vault-pass (or configure vault_password_file in ansible.cfg). Do not “fix” it with ansible-vault decrypt, which writes the plaintext back to disk.
Q02
Do my playbooks change when I encrypt the variables file?
No. The vars_files entry and every {{ variable }} reference stay byte-for-byte identical. Encryption changes the file at rest and adds one requirement at run time: a vault password, via flag or configuration.
Q03
What is the difference between –ask-vault-pass and –ask-become-pass?
--ask-vault-pass decrypts your encrypted files on the control node. --ask-become-pass supplies the sudo password for privilege escalation on managed nodes. Same flag shape, unrelated mechanisms — a single run can legitimately need both.
Q04
What if I lose the vault password?
The file is unrecoverable — AES-256 with no backdoor is the feature. You would recreate the variables file from your records and re-encrypt. This is why the vault password lives in a password manager or CI secret store from day one, and why rekey exists for planned rotations.
Q05
Can I encrypt just one variable instead of the whole file?
Yes — ansible-vault encrypt_string 'SecretValue' --name 'PRI_CLU_PASS' produces an inline-encrypted value you paste into an otherwise plaintext YAML file, keeping non-secret values diffable. Whole-file encryption is simpler to operate; inline strings give finer-grained diffs. Both are legitimate; pick per file.
Q06
Is Ansible Vault enough for production secrets?
For encryption at rest in a repository, yes — it is the standard. Larger estates often layer a dedicated secrets manager (HashiCorp Vault, CyberArk, cloud KMS) behind it via lookup plugins, so credentials are fetched at run time rather than stored at all. Ansible Vault remains the right first step and the right lab habit either way.
Where this leaves you
Five commands now separate your lab from the most common credential failure in automation: encrypt once, --ask-vault-pass per run (or ansible.cfg once), view and edit for day-2, rekey for rotations — and the error that started this article has become a familiar checkpoint instead of a blocker. The habit transfers unchanged to production: the ONTAP playbooks guide runs every example through exactly this pattern, because the playbooks worth keeping are the ones safe to share.
Building automation your auditors will sign off on?
Secrets handling is where automation programs pass or fail review — vault discipline, least-privilege service accounts, and pipelines that never log a credential. WUC engineers build and run automation across NetApp, Cisco, and multi-OEM estates as an automation consultant, infrastructure maintenance provider, and managed services partner.
Prefer to read first? See managed services and post-OEM storage maintenance.
References
- Ansible project. Protecting sensitive data with Ansible Vault. The authoritative guide to encrypt, view, edit, rekey, encrypt_string, and vault IDs.
- Ansible project. netapp.ontap collection documentation. The modules the example playbook drives.
- NetApp Learning Services. STRSW-ILT-RSTAN — Automating ONTAP REST APIs with Ansible. The public workshop whose lab environment this session ran in.
- WUC Technologies. NetApp ONTAP Ansible Playbooks and How to Install Ansible. The playbooks this pattern protects and the control node it runs on.
Find our field guides faster in Google. Add WUC Technologies as a preferred source and our engineering guides carry a “preferred” badge in your Search results, AI Overviews, and AI Mode.
NetApp ONTAP Ansible Playbooks: SVM, Volumes, SMB, NFS, S3, SAN, and Performance Monitoring
Provisioning storage by hand follows the same arc every time: carve out a tenant, give it capacity, then hand that capacity to consumers through whichever doors they need — an SMB share for Windows teams, an NFS export for Linux and VMware, a LUN for databases that want raw blocks, an S3 bucket for backup tools and cloud-native applications. On a NetApp cluster that is an SVM, volumes, and four protocol configurations — twenty-plus System Manager screens of clicking that nobody can review, repeat, or roll back. In Ansible it is seven short YAML files that run in seconds, live in Git, and produce the identical result every single time.
This guide builds the whole estate: seven production-shaped playbooks in dependency order — SVM, volume, SMB, NFS, S3, SAN, and a performance-monitoring playbook that reads back what the others built — each with the real output it produces and a line-by-line explanation of why every parameter is there. It picks up where our Ansible installation guide ends and stands on the API foundation from Managing ONTAP Using the REST API — every module below is a wrapper around those same REST calls.
Seven netapp.ontap playbooks that build a complete storage service from nothing: an SVM (the tenant), a volume (the capacity), then every access door ONTAP offers — SMB configuration with a CIFS server and share, NFS configuration with export policies, S3 configuration with a user and policy-controlled bucket, SAN configuration with an iSCSI LUN mapped to an initiator group — and a performance-monitoring playbook that reads the metrics back. Plus a combined run, an idempotency demonstration, and the troubleshooting table for the errors you will actually hit.
Audience: engineers who have a working Ansible control node and want their first real ONTAP automation. Modules current as of the netapp.ontap collection 23.x against ONTAP 9.12+ over REST.
The four-layer mental model: tenant, capacity, access
Every resource in this guide hangs off the one above it, and getting the order wrong is the most common first-day failure. A storage virtual machine (SVM) is the tenant — an isolated logical storage server with its own namespace, protocols, and security boundary; nothing else can exist without it. A volume is capacity carved from a physical aggregate and — for NAS protocols — mounted into the SVM’s namespace at a junction path. A qtree optionally subdivides a volume for separate quotas and share scoping. And the access layer is what consumers actually touch, in four flavors: an SMB share for Windows file access, an NFS export for Linux and hypervisors, a LUN for block storage, an S3 bucket for object clients. The playbooks below run in exactly this order because the dependencies are real: ONTAP will refuse a volume for an SVM that does not exist, a share whose path is not mounted, and a LUN map to an initiator group that has no members.
Figure 01 · What the seven playbooks build, and what depends on what
The scaffolding every playbook shares
All four playbooks open identically, so we build the skeleton once. Three decisions are baked into it. First, hosts: localhost — ONTAP modules run on the control node and speak HTTPS to the cluster; the cluster is never an SSH target. Second, credentials live in a separate, Vault-encrypted variables file, never in the playbook. Third, instead of repeating hostname / username / password in every task, we declare them once with module_defaults for the whole netapp.ontap action group — every module in the collection inherits them automatically:
mkdir -p ~/ansible/ontap && cd ~/ansible/ontap

# credentials + everything that differs between clusters, kept out of every
# playbook - then encrypted
cat > ontap_vars.yml <<'EOF'
ontap_hostname: cluster1.lab.local
ontap_username: admin
ontap_password: changeme_in_vault
aggr_name: aggr1_node01

# SMB / Active Directory (playbook 3)
ad_domain: corp.example.com
ad_join_user: svc-ontap-join
ad_join_password: changeme_in_vault

# NFS client network (playbook 4)
nfs_client_network: 10.10.20.0/24

# iSCSI initiator of the database host (playbook 6)
db01_iqn: iqn.2026-06.com.example:db01
EOF
ansible-vault encrypt ontap_vars.yml

# confirm the collection resolves before writing any playbook
ansible-doc netapp.ontap.na_ontap_svm | head -4
And the header block that every playbook in this guide starts with — read it once here, because from now on only the tasks: section changes:
---
- name: <what this playbook builds>
  hosts: localhost
  gather_facts: false

  vars_files:
    - ontap_vars.yml

  module_defaults:
    group/netapp.ontap.netapp_ontap:
      hostname: "{{ ontap_hostname }}"
      username: "{{ ontap_username }}"
      password: "{{ ontap_password }}"
      https: true
      validate_certs: true
      use_rest: always
Two parameters deserve a sentence each. use_rest: always forces the module onto the REST API and fails loudly if it would need the retired ZAPI interface — on ONTAP 9.12+ that is the behavior you want, because silent ZAPI fallback is how playbooks break years later. And validate_certs: true is the production setting; flip it to false only in a lab with self-signed certificates, and treat that flip the way you treat any other security exception — temporary, documented, and never copied into production code.
Ansible Vault: keeping the cluster password safe
The scaffolding above ran ansible-vault encrypt ontap_vars.yml with one line of justification; here is the full story, because it solves the tension at the center of everything this guide recommends. Your playbooks belong in Git — that is where review, history, and rollback come from — but your cluster admin password must never be in Git. Vault resolves it by encrypting the variables file with AES-256: the repository holds ciphertext, while every playbook keeps referencing "{{ ontap_password }}" exactly as if nothing happened. The whole lifecycle is five subcommands:
# plaintext -> ciphertext (prompts you to set a vault password)
ansible-vault encrypt ontap_vars.yml

# day-to-day: read or edit without ever leaving plaintext on disk
ansible-vault view ontap_vars.yml
ansible-vault edit ontap_vars.yml      # opens decrypted in $EDITOR, re-encrypts on save

# change the vault password / remove encryption (rarely what you want)
ansible-vault rekey ontap_vars.yml
ansible-vault decrypt ontap_vars.yml
And the part that convinces people — what the file actually looks like at rest. This is everything Git, your backup system, or anyone who walks off with the repository will ever see:
$ cat ontap_vars.yml
$ANSIBLE_VAULT;1.1;AES256
66386439653236336462626566653063336164663966303231363934653561363964363833313662
6431626536303530376336343832656537303632313433360a626438346336353331386135323031
35653463633836383437363161366266363861313464356165653461623264383035363234383431
3263363527338623461370a653635646163343261626632633932386432343336326257303163346
...

$ git diff ontap_vars.yml          # even diffs reveal nothing but new ciphertext
Figure 02 · Where the password is plaintext — and where it never is
How the password gets supplied at run time: interactively with --ask-vault-pass (what every run in this guide uses), or non-interactively with --vault-password-file ~/.vault_pass for cron jobs and CI pipelines — in which case that file needs chmod 600, must never enter Git, and should come from the pipeline’s own secret store. Which is the honest caveat worth stating plainly: Vault relocates the secret problem rather than eliminating it. You trade “credentials scattered through every playbook and repo clone” for “one vault password to protect” — a much better trade, but that one password still needs a home: a password manager, or your CI system’s secret storage.
Three field practices to adopt on day one. Keep secrets in a small dedicated file if you want readable diffs on the non-secret values — encrypting all of ontap_vars.yml, as this guide does for simplicity, is also defensible. Add no_log: true to any task whose parameters would echo a credential into logs when someone runs -vvv in CI. And do not confuse the two similarly shaped flags: --ask-vault-pass decrypts your files; --ask-become-pass is sudo on managed nodes — same shape, different doors.
Reading lab-style playbooks: anchors, aliases, and the merge key
One piece of YAML literacy before the playbooks, because you will meet it the moment you open almost any NetApp training playbook — including the STRSW-ILT-RSTAN workshop repository cloned in our install guide. Older ONTAP playbooks solve the repeated-credentials problem not with module_defaults but with a YAML construct that looks like hieroglyphics the first time you see it:
---
- hosts: localhost
  gather_facts: false
  vars:
    login: &login                     # ANCHOR: bookmark this whole mapping as "login"
      hostname: "{{ ontap_hostname }}"
      username: "{{ ontap_username }}"
      password: "{{ ontap_password }}"
      https: true
      validate_certs: false           # lab setting - never production
      use_rest: always
  collections:
    - netapp.ontap                    # lets tasks use short module names

  tasks:
    - name: Create volume
      na_ontap_volume:
        state: present
        vserver: svm_projects
        name: vol_projects
        aggregate_name: "{{ aggr_name }}"
        size: 10
        size_unit: gb
        <<: *login                    # MERGE KEY + ALIAS: paste the anchor's keys here

    - name: Create share
      na_ontap_cifs:
        state: present
        vserver: svm_projects
        name: finance
        path: /projects
        <<: *login                    # same six keys again, for free
Three symbols carry the whole construct, and none of them is an Ansible feature — this is pure YAML, resolved by the parser before Ansible ever sees the file. &login is an anchor: it bookmarks the mapping it is attached to under a name. *login is an alias: a reference back to that bookmark. And <<: is the merge key: “take the mapping the alias points to and splice its keys into this mapping, right here.” Each task ends up carrying all six connection parameters while the file only states them once.
Figure 03 · What the YAML parser does with an anchor before Ansible runs
Do not take the diagram’s word for it — prove the parse-time expansion in ten seconds on your control node, no cluster required:
python3 - <<'EOF'
import yaml
doc = """
login: &login
  hostname: cluster1
  https: true
task:
  name: vol_projects
  hostname: cluster2     # explicit key - watch what happens to it
  <<: *login
"""
print(yaml.safe_load(doc)['task'])
EOF
$ python3 - <<'EOF'
...
EOF
{'name': 'vol_projects', 'hostname': 'cluster2', 'https': True}
Two rules fall straight out of that output. First, the merge happened inside yaml.safe_load — pure parser behavior, which is why Ansible’s documentation barely mentions anchors: they are not its feature. Second, explicit keys win: the task said hostname: cluster2 and the merge did not overwrite it — so a task can inherit the whole block while overriding one value, deliberately or, more dangerously, by typo. And one rule the output cannot show: anchors do not cross files. An anchor lives only inside the YAML document that defines it — you cannot define &login in a vars file and merge *login in the playbook, which is exactly why lab playbooks define the anchored mapping under vars: in the same file rather than in their global vars file.
So which should you write? Read anchors fluently — every NetApp workshop playbook and half the older ONTAP automation on the internet uses them — but write module_defaults, as this guide does: it is Ansible-native, scoped to the whole collection’s action group, impossible to forget on a newly added task (the merge line is the thing newcomers omit), and it keeps task bodies about storage rather than transport. Anchors earn their keep where module_defaults cannot reach — repeating non-module data structures, like a block of volume attributes shared across loop items. NetApp also publishes prebuilt roles that wrap these flows entirely — na_ontap_nas_create bundles the volume-to-share sequence you are about to build — linked in the references when you are ready to consume rather than compose.
Playbook 1 — create the SVM (the tenant)
The SVM is the unit of multi-tenancy in ONTAP: its own namespace, its own protocol servers, its own security boundary. One task creates it and declares which protocols it will ever be allowed to serve:
cat > 01_svm.yml <<'EOF'
---
- name: Create the project SVM
  hosts: localhost
  gather_facts: false

  vars_files:
    - ontap_vars.yml

  module_defaults:
    group/netapp.ontap.netapp_ontap:
      hostname: "{{ ontap_hostname }}"
      username: "{{ ontap_username }}"
      password: "{{ ontap_password }}"
      https: true
      validate_certs: true
      use_rest: always

  tasks:
    - name: Ensure SVM svm_projects exists
      netapp.ontap.na_ontap_svm:
        state: present
        name: svm_projects
        comment: "Project storage tenant - managed by Ansible"
        services:
          cifs:
            allowed: true
          nfs:
            allowed: true
          s3:
            allowed: true
          iscsi:
            allowed: true
EOF

ansible-playbook 01_svm.yml --ask-vault-pass
$ ansible-playbook 01_svm.yml --ask-vault-pass
Vault password:

PLAY [Create the project SVM] **************************************************

TASK [Ensure SVM svm_projects exists] ******************************************
changed: [localhost]

PLAY RECAP *********************************************************************
localhost    : ok=1    changed=1    unreachable=0    failed=0    skipped=0
What each choice buys you. state: present is the declarative heart of every module in this guide — it reads “make reality match this description,” not “run a create command,” which is why re-running never errors with “already exists.” The task name starts with Ensure for the same reason; it is the vocabulary of desired state. The services block is the SVM’s protocol contract: we allow all four protocols because playbooks 3 through 6 configure them — and on an SVM where you only need some, explicitly disallow the rest, because an SVM that cannot serve a protocol is an SVM nobody can misconfigure into serving it. And changed: [localhost] in the output is Ansible telling you it actually did something; remember that word, because it becomes the whole point in the idempotency section.
Playbook 2 — create the volumes (the capacity)
With the tenant in place, give it capacity. A volume needs four decisions: which physical aggregate backs it, how big it is, where (or whether) it mounts in the SVM’s namespace, and which security style governs its permissions. We need three volumes — one per access style — and rather than three near-identical tasks, one task with a loop declares them all. From this point on, only the tasks: section changes between playbooks; the header is the scaffolding block from above:
cat > 02_volume.yml <<'EOF'
---
- name: Create the project volumes
  hosts: localhost
  gather_facts: false

  vars_files:
    - ontap_vars.yml

  module_defaults:
    group/netapp.ontap.netapp_ontap:
      hostname: "{{ ontap_hostname }}"
      username: "{{ ontap_username }}"
      password: "{{ ontap_password }}"
      https: true
      validate_certs: true
      use_rest: always

  tasks:
    - name: Ensure the project volumes exist
      netapp.ontap.na_ontap_volume:
        state: present
        vserver: svm_projects
        name: "{{ item.name }}"
        aggregate_name: "{{ aggr_name }}"
        size: "{{ item.size }}"
        size_unit: gb
        junction_path: "{{ item.junction | default(omit) }}"
        volume_security_style: "{{ item.style }}"
        comment: "Project capacity - managed by Ansible"
      loop:
        - { name: vol_projects,     size: 10, junction: /projects,     style: ntfs }
        - { name: vol_projects_nfs, size: 10, junction: /projects_nfs, style: unix }
        - { name: vol_projects_san, size: 25,                          style: unix }
EOF

ansible-playbook 02_volume.yml --ask-vault-pass
$ ansible-playbook 02_volume.yml --ask-vault-pass
Vault password:

PLAY [Create the project volumes] **********************************************

TASK [Ensure the project volumes exist] ****************************************
changed: [localhost] => (item={'name': 'vol_projects', 'size': 10, 'junction': '/projects', 'style': 'ntfs'})
changed: [localhost] => (item={'name': 'vol_projects_nfs', 'size': 10, 'junction': '/projects_nfs', 'style': 'unix'})
changed: [localhost] => (item={'name': 'vol_projects_san', 'size': 25, 'style': 'unix'})

PLAY RECAP *********************************************************************
localhost    : ok=1    changed=1    unreachable=0    failed=0    skipped=0
The parameters that bite newcomers, in order. size and size_unit are separate fields — size: 10 with size_unit: gb is ten gigabytes, but forget the unit and you may get the module default instead of what you meant; always set both, explicitly. aggregate_name must name a real aggregate — we parameterized it in ontap_vars.yml precisely because aggregate names are what differ between your lab and your production cluster; the playbook stays identical, only the vars file changes. junction_path is what makes a NAS volume reachable — an unmounted volume exists but no client can see it, the silent cause of “the share works but is empty” tickets. Note the SAN volume has none: default(omit) drops the parameter entirely for that item, because LUNs are addressed by block protocol, not through the namespace. Security styles pair with their consumers — ntfs where Windows ACLs govern (the SMB volume), unix where mode bits do (the NFS and SAN volumes). And the loop itself is the scaling lesson: the day you need a tenth volume, that is one more list line in a Git diff, not a new procedure.
Playbook 3 — SMB configuration (CIFS server, qtree, share)
SMB configuration is three declarative steps: a CIFS server (the SVM’s SMB identity, joined to Active Directory — the part most quick-starts skip), a qtree to scope the share, and the share itself pointing at the qtree’s path:
cat > 03_smb.yml <<'EOF'
---
- name: Configure SMB - CIFS server, qtree, share
  hosts: localhost
  gather_facts: false

  vars_files:
    - ontap_vars.yml

  module_defaults:
    group/netapp.ontap.netapp_ontap:
      hostname: "{{ ontap_hostname }}"
      username: "{{ ontap_username }}"
      password: "{{ ontap_password }}"
      https: true
      validate_certs: true
      use_rest: always

  tasks:
    - name: Ensure the SVM has an AD-joined CIFS server
      netapp.ontap.na_ontap_cifs_server:
        state: present
        vserver: svm_projects
        name: PROJECTS            # becomes the computer object + UNC name
        domain: "{{ ad_domain }}"
        admin_user_name: "{{ ad_join_user }}"
        admin_password: "{{ ad_join_password }}"
        service_state: started

    - name: Ensure qtree finance exists in vol_projects
      netapp.ontap.na_ontap_qtree:
        state: present
        vserver: svm_projects
        flexvol_name: vol_projects
        name: finance
        security_style: ntfs

    - name: Ensure SMB share finance points at the qtree
      netapp.ontap.na_ontap_cifs:
        state: present
        vserver: svm_projects
        name: finance
        path: /projects/finance
        comment: "Finance team share - managed by Ansible"
EOF

ansible-playbook 03_smb.yml --ask-vault-pass
$ ansible-playbook 03_smb.yml --ask-vault-pass
Vault password:

PLAY [Configure SMB - CIFS server, qtree, share] *******************************

TASK [Ensure the SVM has an AD-joined CIFS server] *****************************
changed: [localhost]

TASK [Ensure qtree finance exists in vol_projects] *****************************
changed: [localhost]

TASK [Ensure SMB share finance points at the qtree] ****************************
changed: [localhost]

PLAY RECAP *********************************************************************
localhost    : ok=3    changed=3    unreachable=0    failed=0    skipped=0
The CIFS server task is the one with real-world friction, so read it twice. name: PROJECTS becomes both the computer object in Active Directory and the server half of the UNC path (\\PROJECTS\finance). The join account in ad_join_user needs exactly one right — creating computer objects in the target OU — and it lives in the Vault-encrypted vars file with everything else secret; labs sometimes run workgroup-mode CIFS servers instead, fine for learning, never for production. Then follow the path arithmetic, because it must line up across three resources: the volume mounted at /projects (playbook 2), the qtree finance inside it, so the share’s path is junction plus qtree — /projects/finance. Why a qtree at all, when the share could point at the volume root? Because the qtree is the natural unit for quotas and for carving one volume into several independently shared trees — finance can get a 2 GB quota tomorrow without touching engineering’s tree next to it. Scope note: na_ontap_cifs publishes the share; permissions are governed by NTFS ACLs on the files plus share-level ACLs (na_ontap_cifs_acl if you want those in code too). Windows clients can map the share the moment this recap prints.
Playbook 4 — NFS configuration (service, export policy, rules)
NFS inverts the SMB permission model in one important way: who may mount what is decided by export policies — named sets of rules matching client networks — applied per volume. A brand-new export policy contains no rules, and ONTAP’s default answer to no matching rule is no access; the most common “NFS is broken” ticket is simply a volume still attached to an empty or default policy. So the playbook does four things: enable the NFS service, create a policy, give it a rule, and attach the policy to the volume:
cat > 04_nfs.yml <<'EOF'
---
- name: Configure NFS - service, export policy, rule, volume attachment
  hosts: localhost
  gather_facts: false

  vars_files:
    - ontap_vars.yml

  module_defaults:
    group/netapp.ontap.netapp_ontap:
      hostname: "{{ ontap_hostname }}"
      username: "{{ ontap_username }}"
      password: "{{ ontap_password }}"
      https: true
      validate_certs: true
      use_rest: always

  tasks:
    - name: Ensure the NFS service is enabled on the SVM
      netapp.ontap.na_ontap_nfs:
        state: present
        vserver: svm_projects
        service_state: started
        nfsv3: enabled
        nfsv4: disabled
        nfsv41: enabled

    - name: Ensure export policy projects exists
      netapp.ontap.na_ontap_export_policy:
        state: present
        vserver: svm_projects
        name: projects

    - name: Ensure the project network may read-write the export
      netapp.ontap.na_ontap_export_policy_rule:
        state: present
        vserver: svm_projects
        policy_name: projects
        client_match: "{{ nfs_client_network }}"
        protocol: nfs
        ro_rule: sys
        rw_rule: sys
        super_user_security: none
        allow_suid: false

    - name: Ensure vol_projects_nfs uses the projects policy
      netapp.ontap.na_ontap_volume:
        state: present
        vserver: svm_projects
        name: vol_projects_nfs
        export_policy: projects
EOF

ansible-playbook 04_nfs.yml --ask-vault-pass
$ ansible-playbook 04_nfs.yml --ask-vault-pass
Vault password:

PLAY [Configure NFS - service, export policy, rule, volume attachment] *********

TASK [Ensure the NFS service is enabled on the SVM] ****************************
changed: [localhost]

TASK [Ensure export policy projects exists] ************************************
changed: [localhost]

TASK [Ensure the project network may read-write the export] ********************
changed: [localhost]

TASK [Ensure vol_projects_nfs uses the projects policy] ************************
changed: [localhost]

PLAY RECAP *********************************************************************
localhost    : ok=4    changed=4    unreachable=0    failed=0    skipped=0

# from any host in 10.10.20.0/24, the export now mounts:
$ sudo mount -t nfs svm-projects-data:/projects_nfs /mnt/projects
$ df -h /mnt/projects
Filesystem                       Size  Used Avail Use% Mounted on
svm-projects-data:/projects_nfs  9.5G  256K  9.5G   1% /mnt/projects
The security decisions, parameter by parameter. The version toggles are deliberate: v3 and v4.1 enabled, plain v4.0 disabled — enable what your clients actually use, nothing more. client_match: "{{ nfs_client_network }}" scopes the rule to one CIDR from the vars file; training labs often use 0.0.0.0/0 with ro_rule: any, which reads “everyone, no authentication required” — acceptable in an isolated lab, a finding in an audit. ro_rule: sys / rw_rule: sys requires AUTH_SYS rather than accepting anonymous access, and super_user_security: none squashes root: a root user on a client becomes the anonymous user on the export, so owning a workstation does not mean owning the export. The last task is the step everyone forgets — the policy exists but the volume still points at default; note it is the same na_ontap_volume module from playbook 2, declaring only the property that changes. The mount at the bottom proves the whole chain from a real client.
Playbook 5 — S3 configuration (service, user, bucket)
Modern ONTAP serves S3 natively, which means backup tools, data pipelines, and cloud-native applications can talk to your cluster the same way they talk to AWS — and the provisioning grammar stays exactly the same Ansible you have been writing all guide. Object access is three resources: the per-SVM S3 server (its name becomes part of your endpoint; clients reach it over an HTTPS data LIF), a user (the identity that gets access keys), and a bucket with a policy naming that user:
cat > 05_s3.yml <<'EOF'
---
- name: Configure S3 - service, user, bucket
  hosts: localhost
  gather_facts: false

  vars_files:
    - ontap_vars.yml

  module_defaults:
    group/netapp.ontap.netapp_ontap:
      hostname: "{{ ontap_hostname }}"
      username: "{{ ontap_username }}"
      password: "{{ ontap_password }}"
      https: true
      validate_certs: true
      use_rest: always

  tasks:
    - name: Ensure the SVM has an S3 server
      netapp.ontap.na_ontap_s3_services:
        state: present
        vserver: svm_projects
        name: s3-projects
        enabled: true
        comment: "S3 endpoint - managed by Ansible"

    - name: Ensure S3 user app_backup exists
      netapp.ontap.na_ontap_s3_users:
        state: present
        vserver: svm_projects
        name: app_backup
        comment: "Backup application identity - managed by Ansible"
      register: s3_user

    - name: Show the access keys ONCE - store them in your secrets manager now
      ansible.builtin.debug:
        msg:
          - "access_key: {{ s3_user.access_key | default('(unchanged - keys only issued on creation)') }}"
          - "secret_key: {{ s3_user.secret_key | default('(unchanged - keys only issued on creation)') }}"

    - name: Ensure bucket backups-projects exists with a least-privilege policy
      netapp.ontap.na_ontap_s3_buckets:
        state: present
        vserver: svm_projects
        name: backups-projects
        size: 26843545600        # 25 GB, in bytes
        comment: "Backup target - managed by Ansible"
        policy:
          statements:
            - sid: AllowBackupAppReadWrite
              effect: allow
              principals:
                - app_backup
              resources:
                - backups-projects
                - backups-projects/*
              actions:
                - GetObject
                - PutObject
                - ListBucket
EOF

ansible-playbook 05_s3.yml --ask-vault-pass
$ ansible-playbook 05_s3.yml --ask-vault-pass
Vault password:

PLAY [Configure S3 - service, user, bucket] ************************************

TASK [Ensure the SVM has an S3 server] *****************************************
changed: [localhost]

TASK [Ensure S3 user app_backup exists] ****************************************
changed: [localhost]

TASK [Show the access keys ONCE - store them in your secrets manager now] ******
ok: [localhost] => {
    "msg": [
        "access_key: 7K2RW9X1B4N8PQ55V0T3",
        "secret_key: mJ9cE2hVq8Lw4yA6nZsB1xD7fG3kP0rT5uI8oH2e"
    ]
}

TASK [Ensure bucket backups-projects exists with a least-privilege policy] *****
changed: [localhost]

PLAY RECAP *********************************************************************
localhost    : ok=4    changed=3    unreachable=0    failed=0    skipped=0
The S3 server’s name: s3-projects is not cosmetic — it anchors the endpoint your clients configure, served over an HTTPS data LIF (in production, put a CA-signed certificate on it; the module family handles that too). After that, three things in this playbook are security decisions disguised as syntax. The register: s3_user plus debug task exists because ONTAP issues the secret key exactly once, at user creation — it cannot be retrieved later, only regenerated. Capture it on the spot and move it into your secrets manager; on every later run the default() filter prints a calm placeholder instead of failing. The bucket size is in bytes — unlike the volume module’s size_unit, this module takes one big number, so we annotate the arithmetic in a comment rather than make reviewers count digits. And the policy block is deliberate least privilege: app_backup can read, write, and list this bucket only — note the two resource lines, the bucket itself for ListBucket and bucket/* for the object operations — and has no rights to any other bucket on the SVM. That is tighter than most quick-start guides teach, and exactly as tight as a backup credential should be.
Playbook 6 — SAN configuration (iSCSI service, igroup, LUN, map)
Block storage swaps the NAS vocabulary for SAN’s: instead of paths and exports, a LUN (a virtual disk file living inside a volume), an initiator group (the list of client iSCSI identities — IQNs — allowed to see it), and a map binding the two. The host sees a raw disk; what it does with it — partition, format, hand to a database — is its business. Four declarative steps:
cat > 06_san.yml <<'EOF'
---
- name: Configure SAN - iSCSI service, igroup, LUN, mapping
  hosts: localhost
  gather_facts: false

  vars_files:
    - ontap_vars.yml

  module_defaults:
    group/netapp.ontap.netapp_ontap:
      hostname: "{{ ontap_hostname }}"
      username: "{{ ontap_username }}"
      password: "{{ ontap_password }}"
      https: true
      validate_certs: true
      use_rest: always

  tasks:
    - name: Ensure the iSCSI service is started on the SVM
      netapp.ontap.na_ontap_iscsi:
        state: present
        vserver: svm_projects
        service_state: started

    - name: Ensure igroup ig_db01 contains the database host initiator
      netapp.ontap.na_ontap_igroup:
        state: present
        vserver: svm_projects
        name: ig_db01
        group_type: iscsi
        os_type: linux
        initiator_names:
          - "{{ db01_iqn }}"

    - name: Ensure LUN lun_db01 exists in vol_projects_san
      netapp.ontap.na_ontap_lun:
        state: present
        vserver: svm_projects
        flexvol_name: vol_projects_san
        name: lun_db01
        size: 20
        size_unit: gb
        os_type: linux
        space_reserve: false

    - name: Ensure lun_db01 is mapped to ig_db01
      netapp.ontap.na_ontap_lun_map:
        state: present
        vserver: svm_projects
        path: /vol/vol_projects_san/lun_db01
        initiator_group_name: ig_db01
EOF

ansible-playbook 06_san.yml --ask-vault-pass
$ ansible-playbook 06_san.yml --ask-vault-pass
Vault password:

PLAY [Configure SAN - iSCSI service, igroup, LUN, mapping] *********************

TASK [Ensure the iSCSI service is started on the SVM] **************************
changed: [localhost]

TASK [Ensure igroup ig_db01 contains the database host initiator] **************
changed: [localhost]

TASK [Ensure LUN lun_db01 exists in vol_projects_san] **************************
changed: [localhost]

TASK [Ensure lun_db01 is mapped to ig_db01] ************************************
changed: [localhost]

PLAY RECAP *********************************************************************
localhost    : ok=4    changed=4    unreachable=0    failed=0    skipped=0

# on the database host, after an iSCSI rescan, the new disk appears:
$ sudo iscsiadm -m session --rescan
Rescanning session [sid: 1, target: iqn.1992-08.com.netapp:sn...]
$ lsblk | grep sdb
sdb      8:16   0   20G  0 disk
The two parameters that prevent 2 a.m. incidents. os_type appears twice — on the igroup and on the LUN — and both matter: they control the SCSI geometry and alignment ONTAP presents, and a mismatch (a linux LUN mapped to a vmware igroup) produces the kind of subtle misalignment that surfaces as a performance mystery months later. Set both, correctly, to what the consumer actually is. space_reserve: false thin-provisions the LUN — the right default on a thin-provisioned, monitored estate, but it means the volume can promise more than the aggregate holds, which is precisely why playbook 7 watches capacity. The igroup is your access control list: a LUN is visible to exactly the IQNs in the mapped igroup, nothing else on the network — so treat initiator_names with the same review discipline as a firewall rule. And note the LUN path grammar ONTAP uses for maps: /vol/<volume>/<lun> — a namespace all its own, unrelated to NAS junction paths; the SAN volume deliberately has no junction at all.
Playbook 7 — performance monitoring (read everything back)
The last playbook changes nothing, ever — and that is its value. na_ontap_rest_info is the collection’s read-only window onto the same REST endpoints our ONTAP REST guide walks by hand; asked for the right fields, it returns live IOPS, latency, and throughput for every volume the other six playbooks built:
cat > 07_perf.yml <<'EOF'
---
- name: Collect performance metrics for the project volumes
  hosts: localhost
  gather_facts: false

  vars_files:
    - ontap_vars.yml

  module_defaults:
    group/netapp.ontap.netapp_ontap:
      hostname: "{{ ontap_hostname }}"
      username: "{{ ontap_username }}"
      password: "{{ ontap_password }}"
      https: true
      validate_certs: true
      use_rest: always

  tasks:
    - name: Pull volume metrics over REST
      netapp.ontap.na_ontap_rest_info:
        gather_subset:
          - storage/volumes
        parameters:
          svm.name: svm_projects
        fields:
          - name
          - space.size
          - space.used
          - metric
      register: perf

    - name: Report IOPS, latency, and throughput per volume
      ansible.builtin.debug:
        msg: >-
          {{ item.name }}:
          iops={{ item.metric.iops.total }}
          latency_us={{ item.metric.latency.total }}
          throughput_bps={{ item.metric.throughput.total }}
          used={{ (item.space.used / item.space.size * 100) | round(1) }}%
      loop: "{{ perf.ontap_info['storage/volumes'].records }}"
      loop_control:
        label: "{{ item.name }}"
EOF

ansible-playbook 07_perf.yml --ask-vault-pass
$ ansible-playbook 07_perf.yml --ask-vault-pass
Vault password:

PLAY [Collect performance metrics for the project volumes] *********************

TASK [Pull volume metrics over REST] *******************************************
ok: [localhost]

TASK [Report IOPS, latency, and throughput per volume] *************************
ok: [localhost] => (item=vol_projects) => {
    "msg": "vol_projects: iops=142 latency_us=412 throughput_bps=8388608 used=31.4%"
}
ok: [localhost] => (item=vol_projects_nfs) => {
    "msg": "vol_projects_nfs: iops=87 latency_us=389 throughput_bps=4194304 used=12.7%"
}
ok: [localhost] => (item=vol_projects_san) => {
    "msg": "vol_projects_san: iops=1204 latency_us=801 throughput_bps=52428800 used=64.2%"
}

PLAY RECAP *********************************************************************
localhost    : ok=2    changed=0    unreachable=0    failed=0    skipped=0
How to read what comes back. The metric field is ONTAP’s rolled-up recent performance sample per volume — iops.total, latency.total (microseconds), throughput.total (bytes/second) — ideal for trend lines and run-to-run comparison; for deep forensic counters, the REST cluster/counter/tables endpoints go further, same module, different subset. The number to watch first is latency: IOPS and throughput describe how hard the system is working, latency describes whether anyone is suffering — a database volume drifting from 800 to 8,000 microseconds is a problem long before any capacity alarm fires. Note used=64.2% on the thin-provisioned SAN volume: that is the watch-item space_reserve: false created in playbook 6, surfaced by exactly the playbook designed to watch it. Schedule this nightly next to the --check run and you have a performance baseline in your job logs before you ever need one — the difference between “it feels slow” and “latency tripled on Tuesday at 14:00.”
Running it all as one: site.yml
Seven files keep the building blocks reviewable, but a service is provisioned as a unit. import_playbook chains them in dependency order — and this short file is now the canonical, re-runnable definition of your storage service:
cat > site.yml <<'EOF'
---
- import_playbook: 01_svm.yml
- import_playbook: 02_volume.yml
- import_playbook: 03_smb.yml
- import_playbook: 04_nfs.yml
- import_playbook: 05_s3.yml
- import_playbook: 06_san.yml
- import_playbook: 07_perf.yml
EOF

# preview against a live cluster without changing anything
ansible-playbook site.yml --ask-vault-pass --check

# then for real
ansible-playbook site.yml --ask-vault-pass
The --check run first is the habit worth keeping from our production practices: it reports what would change without touching the cluster — a free dress rehearsal before every change window. Put the directory in Git and the pull request that modifies 02_volume.yml’s size line is your capacity-change record.
The idempotency proof: run it twice
Here is the property that separates automation from scripting, demonstrated in one command. Run site.yml a second time, immediately, changing nothing:
$ ansible-playbook site.yml --ask-vault-pass
Vault password:

TASK [Ensure SVM svm_projects exists] ******************************************
ok: [localhost]

TASK [Ensure the project volumes exist] ****************************************
ok: [localhost] => (item={'name': 'vol_projects', ...})
ok: [localhost] => (item={'name': 'vol_projects_nfs', ...})
ok: [localhost] => (item={'name': 'vol_projects_san', ...})

TASK [Ensure the SVM has an AD-joined CIFS server] *****************************
ok: [localhost]

TASK [Ensure SMB share finance points at the qtree] ****************************
ok: [localhost]

TASK [Ensure the project network may read-write the export] ********************
ok: [localhost]

TASK [Ensure S3 user app_backup exists] ****************************************
ok: [localhost]

TASK [Ensure lun_db01 is mapped to ig_db01] ************************************
ok: [localhost]

... (every remaining task: ok)

PLAY RECAP *********************************************************************
localhost    : ok=18   changed=0    unreachable=0    failed=0    skipped=0
Figure 04 · Same playbook, two runs — why changed=0 is the whole point
Read what that buys you operationally. A changed=0 run is a free audit — schedule it nightly and any run that suddenly reports changed=1 is drift detected and already corrected, with a timestamped log of what diverged. If a colleague resizes the volume by hand in System Manager, the next run quietly puts it back and tells you it did. This is why the playbooks say state: present and “Ensure” everywhere: you wrote a description of how storage should look, and the cluster now has a standing enforcement mechanism. No hand-run CLI procedure offers any equivalent.
Troubleshooting: the errors you will actually hit
ONTAP module failures are verbose but predictable. The eight that account for nearly every first-week incident:
| Symptom in the failure message | Likely cause | Resolution |
|---|---|---|
401 / not authorized |
Wrong credentials, or the account lacks REST API access | Verify the vaulted values; confirm the ONTAP account has the http application enabled and a sufficient role (admin, or a scoped REST role). |
SSL: CERTIFICATE_VERIFY_FAILED |
validate_certs: true against a self-signed lab certificate |
Install a trusted certificate (right answer), or set validate_certs: false in the lab vars file only — never in the playbook itself. |
aggregate ... not found or no aggregates eligible |
aggr_name names an aggregate that does not exist on this cluster, or is a root aggregate |
List real data aggregates first (na_ontap_rest_info with storage/aggregates, or storage aggregate show) and fix the vars file — not the playbook. |
| CIFS server task fails on the domain join | Join account lacks rights to create the computer object, or DNS cannot resolve the domain from the SVM’s LIFs | Verify ad_join_user can create computer objects in the target OU, and that the SVM’s DNS configuration resolves ad_domain — the join happens from the SVM’s network, not the control node’s. |
| Bucket or S3 user task fails referencing the S3 service | No S3 server on the SVM, or no HTTPS data LIF for clients | Run the S3 server task from playbook 5 first and confirm a reachable data LIF with a valid certificate. |
NFS mount succeeds nowhere, or access denied by server |
Volume still attached to an empty or default export policy, or client_match does not cover the client |
Check the last task of playbook 4 ran (volume → policy attachment is the step everyone forgets), then verify the client’s IP actually falls inside nfs_client_network. |
| LUN exists but the host sees no disk after rescan | LUN not mapped, IQN mismatch in the igroup, or iSCSI service not started | Verify in playbook 6’s order: service started → igroup contains the host’s exact IQN (one character off is invisible-disk syndrome) → map exists for /vol/vol_projects_san/lun_db01. |
ModuleNotFoundError or import errors before any API call |
Collection or Python libraries missing from the environment Ansible runs in | Back to the install guide’s storage extras: ansible-galaxy collection install netapp.ontap plus netapp-lib into Ansible’s own environment. |
The diagnostic order mirrors the dependency stack in Figure 01: authentication first, then the physical layer (aggregates), then per-SVM protocol servers, then the resource itself. Errors at one layer masquerade as errors at the layer above it — a missing CIFS server looks like a share problem — so when a task fails, check its prerequisites before its parameters.
From tasks to roles: when to package what you built
Everything in this guide is task-level Ansible — deliberately, because at task level you see every moving part. But the moment a second team wants “the standard NAS provisioning flow,” copying task blocks between playbooks starts producing divergent copies, and Ansible’s answer to that is the role. The mental model in one line: a task is a sentence, a playbook is a page, a role is a chapter you can hand to someone else. A role packages a task list together with everything it needs to travel — default variables, handlers, templates — in a directory layout Ansible knows how to load:
roles/ontap_nas/
├── tasks/main.yml        # the task list - the "what" (volume, qtree, share)
├── defaults/main.yml     # overridable variable defaults - the interface
├── vars/main.yml         # fixed internal variables
├── handlers/main.yml     # tasks triggered on change
├── templates/            # Jinja2 files, if any
└── meta/main.yml         # dependencies on other roles
A playbook then invokes the chapter instead of containing it — the forty lines of tasks from playbooks 2 and 3 collapse to a role name plus the variables that make this use of it unique:
---
- name: Provision NAS storage via the shared role
  hosts: localhost
  gather_facts: false
  vars_files:
    - ontap_vars.yml

  roles:
    - role: ontap_nas
      vars:
        nas_volume: vol_projects
        nas_size_gb: 10
        nas_qtree: finance
        nas_share: finance
The decision rule for when to graduate: repetition across contexts. A loop handles repetition inside one playbook — the three volumes in playbook 2. A role handles repetition across playbooks, projects, and teams: one tested implementation, variables as the interface, fixes made once and inherited everywhere. This is exactly what NetApp ships on Galaxy — the na_ontap_nas_create role in the references is the volume-to-share sequence you built by hand, packaged so a consumer sets half a dozen variables instead of writing forty lines. The progression this article deliberately follows: compose with tasks while learning, consume roles in production once you trust the parts — engineers who start with the role and skip the tasks end up unable to troubleshoot it, which is why the troubleshooting table above speaks in module terms.
Frequently asked questions
Q01
Do these playbooks install anything on the NetApp cluster?
No. Every netapp.ontap module runs on the Ansible control node and drives the cluster’s REST API over HTTPS — the cluster needs nothing installed and is never an SSH target. hosts: localhost in every playbook is that architecture made explicit.
Q02
What do I need before running these?
A working control node with the netapp.ontap collection and netapp-lib Python library installed, network reachability to the cluster management LIF over HTTPS, and an ONTAP account with REST access. Our installation guide builds exactly this, including the storage extras.
Q03
Is it safe to re-run these playbooks?
Yes — that is the design. Every module is idempotent: state: present means “make reality match this description,” so a re-run against a compliant cluster reports changed=0 and modifies nothing. Re-running is how you audit; the recap line is the result.
Q04
Why does the S3 secret key only appear once?
ONTAP issues the secret key at user creation and never exposes it again — the same model as AWS IAM. Capture it from the registered result at creation time and store it in a secrets manager. If it is lost, regenerate the key pair; nothing recovers the old one.
Q05
Can I delete what these playbooks created?
Yes — the same playbooks with state: absent remove each resource, in reverse dependency order (LUN map, share, export rules, and bucket first; then volumes; then the SVM). Treat state: absent on volumes and SVMs with change-control seriousness: it deletes data, and Ansible will not ask twice.
Q06
Do these work over ZAPI, or only REST?
The playbooks set use_rest: always, forcing the REST API — the right choice on ONTAP 9.12+ since ZAPI is retired in current releases. On very old clusters the collection can fall back to ZAPI, but building new automation on a retired interface buys technical debt on day one.
Q07
How do I adapt the examples to my environment?
Change the vars file, not the playbooks: cluster hostname, credentials, aggregate name, AD details, client network, and initiator IQN all live in ontap_vars.yml. Resource names (SVM, volumes, qtree, share, bucket, user, igroup) are organizational choices — rename freely, keeping the path arithmetic consistent: share path = junction path + qtree name.
Q08
What does <<: *login mean in NetApp’s example playbooks?
It is a YAML merge key plus alias: &login bookmarks a mapping (usually the six connection parameters), *login references it, and <<: splices its keys into the task at parse time — before Ansible runs. Explicit task keys win over merged ones, and anchors cannot cross files. It is the older idiom for exactly what module_defaults does natively; read it fluently, write module_defaults.
Q09
How does NFS access control differ from SMB’s?
SMB authenticates users via the AD-joined CIFS server, then NTFS ACLs govern files. NFS (with AUTH_SYS) authorizes client machines via export policy rules matched against their IP, then UNIX mode bits govern files. That is why the NFS playbook is mostly export-policy work — and why a volume attached to an empty policy mounts nowhere: no matching rule means no access.
Q10
How does Ansible Vault keep the cluster password safe?
Vault encrypts the variables file with AES-256, so Git, clones, and backups only ever hold ciphertext while playbooks keep referencing {{ ontap_password }} unchanged. Decryption happens in memory at run time, supplied via --ask-vault-pass or a chmod 600 password file from your CI secret store. One honest caveat: Vault relocates the secret problem — the vault password itself still needs a home in a password manager or CI secret storage.
Q11
What is the difference between an Ansible task and a role?
A task is one unit of work — a single module call like “ensure this volume exists.” A role is a reusable package of tasks plus their defaults, handlers, and templates in a standard directory layout, invoked by name with variables as its interface. Graduate from tasks to roles when the same flow repeats across playbooks or teams — NetApp’s na_ontap_nas_create Galaxy role is this guide’s volume-to-share flow in packaged form.
Where this leaves you
Seven short files now describe a complete storage service — tenant, capacity, and all four access doors: SMB for the Windows teams, NFS for Linux and hypervisors, S3 for the backup tooling, a LUN for the database — plus the read-only playbook that watches it all. One command builds, rebuilds, or audits the lot. The pattern you practiced here is the entire discipline in miniature: declare state, scope privilege tightly (export policy CIDRs, igroup IQNs, bucket policies — the same least-privilege idea wearing three costumes), keep secrets in Vault, parameterize what differs between clusters, and let changed=0 be your compliance report. Scaling up is repetition, not new concepts: more volumes are more loop items, more tenants are more vars files, snapshot policies and quotas are more modules in the identical grammar.
The natural next steps: put ~/ansible/ontap in Git today; wire site.yml --check plus the performance playbook into a nightly job and read the drift and latency reports; explore NetApp’s prebuilt Galaxy roles like na_ontap_nas_create (referenced below), which package these same flows once you trust the building blocks; and when a second cluster arrives, prove the point by provisioning it with the same playbooks and a different vars file. That last run — identical service, new cluster, zero new code — is the moment storage automation pays for itself.
Automating NetApp storage across a production estate?
Playbooks are the easy mile; the operating model around them — change control, drift enforcement, multi-cluster vars hygiene, secrets handling — is where estates succeed or stall. WUC engineers build and run both, as an automation consultant, infrastructure maintenance provider, and managed services partner across NetApp, Cisco, and multi-OEM environments.
Prefer to read first? See managed services and post-OEM storage maintenance.
References
- Ansible project. netapp.ontap collection documentation. The authoritative reference for every module used here — na_ontap_svm, na_ontap_volume, na_ontap_cifs_server, na_ontap_cifs, na_ontap_nfs, na_ontap_export_policy_rule, na_ontap_s3_services, na_ontap_s3_users, na_ontap_s3_buckets, na_ontap_iscsi, na_ontap_igroup, na_ontap_lun, na_ontap_lun_map, and na_ontap_rest_info.
- Ansible Galaxy. netapp.ontap role: na_ontap_nas_create. NetApp’s prebuilt role packaging the volume-to-share NAS flow built by hand in playbooks 2–4 — the consume-rather-than-compose option once the building blocks are familiar.
- NetApp. ONTAP Automation Documentation. The REST API foundation every module in this guide drives.
- NetApp Learning Services. STRSW-ILT-RSTAN — Automating ONTAP REST APIs with Ansible. The public workshop repository whose lab environment inspired these examples; the playbooks above are original and production-shaped rather than lab-specific.
- WUC Technologies. Managing ONTAP Using the REST API and How to Install Ansible. The API foundation and the control-node build this guide assumes.
Find our field guides faster in Google. Add WUC Technologies as a preferred source and our engineering guides carry a “preferred” badge in your Search results, AI Overviews, and AI Mode.
How to Install Ansible: OS Requirements and a Clean Setup, Step by Step
Picture the estate most infrastructure teams actually run: two hundred Linux servers patched by hand on a rotating schedule, a NetApp ONTAP cluster whose volumes get provisioned through the same ticket queue they did five years ago, Cisco switches configured one SSH session at a time — and a quiet, compounding drift between what the documentation says and what the machines actually do. Ansible is the standard answer to that picture: agentless configuration management and Infrastructure as Code that turns repeated manual work into version-controlled, repeatable automation across servers, storage, and network gear alike.
But every Ansible journey starts — and too many stall — in the same place: getting a clean, upgradeable installation onto the right machine. Install Ansible the wrong way — the distro’s ancient package, a root pip that fights the system Python, the wrong machine entirely — and you inherit a toolchain that breaks on its first upgrade. This guide covers how to install Ansible properly and then proves it works: OS requirements, three installation methods ranked by how well they age, verification, your first inventory and commands, and a real NetApp ONTAP playbook at the end — because an installed tool is only the beginning.
The full path from zero to working automation: why enterprises adopt Ansible, how the architecture works, control and managed node OS requirements, the ansible vs ansible-core decision, installs via pipx, pip, and OS package managers, verification, your first inventory, ad-hoc commands, and privilege escalation — then a real NetApp ONTAP playbook, a troubleshooting table for the first week, and the practices that make it production-safe.
Audience: engineers standing up their first control node, and anyone inheriting one that was installed three ways at once. Current as of ansible-core 2.19 / Ansible 12.
Why infrastructure engineers use Ansible
Ansible is an automation engine that describes the desired state of infrastructure in plain YAML and makes reality match it — the working definition of Infrastructure as Code. What that means day to day, across the estates we operate:
- Server automation and configuration management — patch two hundred machines with one playbook run instead of two hundred sessions; the playbook is the documentation, and drift stops accumulating because every run re-asserts the desired state.
- NetApp ONTAP automation — volumes, SVMs, exports, snapshots, and quotas declared in YAML through the
netapp.ontapcollection, every module a wrapper around the ONTAP REST API. Storage requests stop being tickets and start being pull requests. - Cisco network automation — VLANs, interface descriptions, and compliance baselines pushed consistently across the fabric instead of hand-typed per switch; the same discipline our Catalyst field guide applies manually, executed at fleet scale.
- VMware administration and cloud provisioning — the
community.vmwareand cloud collections drive vCenter, AWS, and Azure through the same playbook grammar, so one skill covers the hypervisor and the cloud account. - Compliance enforcement — a playbook that asserts SSH hardening, audit rules, and banner text is a control you can re-run before every audit; the run log is the evidence.
One observation from enterprise environments worth internalizing before you install anything: the teams that succeed with Ansible treat it as an operating discipline — inventory in version control, changes through review, runs through a pipeline — not as a faster way to type. The install below is fifteen minutes; that discipline is the actual project.
How Ansible connects: one machine runs it, the rest just listen
Ansible is agentless. You install it on exactly one machine — the control node — and it manages everything else (the managed nodes) over SSH, PowerShell remoting for Windows targets, or device-specific transports for network gear. No agents to deploy, no daemons to babysit, no database. That single fact answers the question most newcomers ask first: where do I install it? On your workstation, a jump host, or a small VM — not on the servers being managed.
Figure 01 · Agentless architecture — install once, manage many
Four terms carry the whole vocabulary, and each answers one question:
- Inventory answers who — a text file (INI or YAML) listing the hosts you manage, organized into groups like
[linux]or[storage]. You build one later in this guide. - Playbook answers what — a YAML file describing the desired end state as an ordered list of tasks. Playbooks are the artifact you put in Git.
- Module answers how — the unit of work a task calls:
ansible.builtin.dnfinstalls packages,netapp.ontap.na_ontap_volumecreates ONTAP volumes. Modules are idempotent — they change something only if it differs from the declared state, which is why re-running a playbook is safe. - Collection answers where modules come from — the packaging format that bundles modules and plugins for one platform (
cisco.ios,netapp.ontap,community.vmware), installed withansible-galaxy.
Hold the chain in your head — inventory picks the hosts, the playbook orders the tasks, each task calls a module, and collections supply the modules — and every command in the rest of this guide reads naturally.
OS requirements: control node and managed nodes
The requirements split cleanly along the architecture line, and the official position is short enough to memorize:
| Role | Supported operating systems | What it needs |
|---|---|---|
| Control node (runs Ansible) | Nearly any UNIX-like OS with Python: Red Hat family, Debian, Ubuntu, macOS, the BSDs — and Windows only inside WSL. Native Windows is not supported as a control node | A recent Python 3 (check the support matrix for your ansible-core version’s exact floor), plus pip or pipx |
| Managed node (gets managed) | Any Linux/UNIX reachable over SSH; Windows via PowerShell remoting | No Ansible install. Python to execute the generated task code, and a user account with SSH and an interactive POSIX shell |
| Network / storage devices | Switches, SAN fabrics, storage arrays | Often nothing on-device — their modules are documented exceptions that run on the control node against the device API |
The one that surprises people: Windows cannot be a control node natively. A Windows laptop runs Ansible perfectly well — inside a WSL Ubuntu or similar distribution, which then satisfies the UNIX-like requirement. Windows machines as managed targets, by contrast, are fully supported.
One decision before installing: ansible or ansible-core
The community distribution ships two packages, and knowing which you installed saves confusion later:
ansible-core— the minimal engine: the language, runtime, and a small set of built-in modules. You add only the collections you need viaansible-galaxy.ansible— the batteries-included package: ansible-core plus a large community-curated set of collections covering clouds, operating systems, network vendors, and storage platforms.
For a first control node, ansible is the friction-free choice. For containers, CI pipelines, and estates under change control, ansible-core plus an explicit, version-pinned collection list is the disciplined one — you know exactly what code can touch production. Every command below works with either name.
Choosing an install method
Figure 02 · Which install method, in one decision
Method 1 — pipx (recommended)
Modern Linux distributions increasingly mark their system Python as externally managed and refuse bare pip install commands. pipx exists for exactly this world: it installs each Python application into its own isolated environment and puts the commands on your PATH — no fighting the OS, no flags that disable safety rails. Run these:
pipx install --include-deps ansible

# alternatives: the minimal engine, or a pinned version for reproducible estates
pipx install ansible-core
pipx install ansible-core==2.19.1

# upgrade later, in place
pipx upgrade --include-injected ansible

# add extra Python libraries that modules need (example: argcomplete)
pipx inject ansible argcomplete
What a healthy install session looks like:
$ pipx install --include-deps ansible
  installed package ansible 12.1.0, installed using Python 3.12.4
  These apps are now globally available
    - ansible
    - ansible-community
    - ansible-config
    - ansible-console
    - ansible-doc
    - ansible-galaxy
    - ansible-inventory
    - ansible-playbook
    - ansible-pull
    - ansible-vault
done! ✓

$ pipx upgrade --include-injected ansible
upgraded package ansible from 12.0.0 to 12.1.0

$ pipx inject ansible argcomplete
  injected package argcomplete into venv ansible
And if you ever wonder why this guide does not simply say pip install ansible against the system Python — this refusal, on any current Debian-family or similar distro, is the answer:
$ pip install ansible
error: externally-managed-environment

× This environment is externally managed
╰> To install Python packages system-wide, try apt install python3-xyz...
   If you wish to install a non-Debian-packaged Python package, create
   a virtual environment...
   hint: See PEP 668 for the detailed specification.
The inject subcommand matters more than it looks: module dependencies (the NetApp library in the storage section below, cloud SDKs, and so on) must live in the same environment Ansible runs from, and inject is how they get there under pipx.
Method 2 — pip
The classic, officially supported route. First confirm which Python you are installing under, and that pip exists for it:
# confirm which Python and that pip exists for it
python3 -m pip -V

# install for the current user - no root, no system Python pollution
python3 -m pip install --user ansible

# minimal engine instead / upgrade in place
python3 -m pip install --user ansible-core
python3 -m pip install --upgrade --user ansible
And the session you should expect:
$ python3 -m pip -V
pip 24.2 from /usr/lib/python3.12/site-packages/pip (python 3.12)

$ python3 -m pip install --user ansible
Collecting ansible
  Downloading ansible-12.1.0-py3-none-any.whl (51.2 MB)
Collecting ansible-core~=2.19.1 (from ansible)
  Downloading ansible_core-2.19.1-py3-none-any.whl (2.4 MB)
Collecting jinja2>=3.0.0 (from ansible-core~=2.19.1->ansible)
...
Installing collected packages: resolvelib, PyYAML, packaging, MarkupSafe,
  cryptography, jinja2, ansible-core, ansible
Successfully installed ansible-12.1.0 ansible-core-2.19.1 ...
Run pip as root and it tells you exactly why you should not: WARNING: Running pip as the 'root' user can result in broken permissions and conflicting behaviour with the system package manager. It is recommended to use a virtual environment instead. Heed it — that warning is the prologue to a broken system Python. And if you typo a package name, pip says so in its own dialect: ERROR: Could not find a version that satisfies the requirement islo_log (from versions: none) means “no such package” — the fix is spelling (oslo_log), not retrying. And one reassurance: re-running an install you already completed prints Requirement already satisfied for each package — that is pip confirming idempotency, not complaining.
Two notes from production: always invoke pip as python3 -m pip so there is no ambiguity about which interpreter you are installing into, and if the freshly installed ansible command is “not found,” add ~/.local/bin to your PATH — that is where --user installs put executables. Teams already living in virtual environments can drop --user and install into a venv per project, which is the tidiest answer of all for shared jump hosts.
Method 3 — OS packages
Every major platform packages Ansible. Convenient, supported by your distro — and frequently a version or three behind, so check what you are getting:
# Ubuntu / Debian
sudo apt update && sudo apt install ansible

# RHEL / Rocky / Alma - ansible-core lives in the base repos,
# the full package arrives with EPEL
sudo dnf install epel-release
sudo dnf install ansible

# Fedora
sudo dnf install ansible

# macOS
brew install ansible
The RHEL-family pattern — enable EPEL, then install — is the same one NetApp’s own Ansible training labs use, and it is the right call on a fresh Rocky or Alma jump host. Just check what you actually received, because this is where distro lag bites:
$ ansible --version | head -1
ansible [core 2.16.3]        # an LTS distro can be several releases behind
                             # current; some collections will refuse it
Verify the install — three commands, no excuses
# 1. the engine version (reports ansible-core)
ansible --version

# 2. the full-package version, if you installed "ansible"
ansible-community --version

# 3. prove execution end to end against the control node itself
ansible localhost -m ansible.builtin.ping
Healthy output for all three:
$ ansible --version
ansible [core 2.19.1]
  config file = None
  configured module search path = ['/home/ops/.ansible/plugins/modules', ...]
  ansible python module location = /home/ops/.local/share/pipx/venvs/ansible/...
  executable location = /home/ops/.local/bin/ansible
  python version = 3.12.4 (main, Jun  4 2026) [GCC 13.2.0]
  jinja version = 3.1.4

$ ansible-community --version
Ansible community version 12.1.0

$ ansible localhost -m ansible.builtin.ping
localhost | SUCCESS => {
    "changed": false,
    "ping": "pong"
}
The ping module is not ICMP — it executes a tiny task through the full Ansible machinery and reports back, which makes that one line a genuine end-to-end test of the runtime. Three lines of that version output deserve a second look. config file = None is normal on a fresh install — Ansible searches for ansible.cfg in this order: the ANSIBLE_CONFIG environment variable, the current directory, ~/.ansible.cfg, then /etc/ansible/ansible.cfg — and runs on defaults if none exists. python version tells you exactly which interpreter Ansible lives in, which is where module dependencies must also be installed. And executable location confirms which install method actually won if a machine has history.
Two more verification commands worth running before you call it done — what collections you have, and what configuration differs from defaults:
# 4. list installed collections (the full "ansible" package ships dozens)
ansible-galaxy collection list

# 5. show only configuration you have changed from defaults (empty = clean install)
ansible-config dump --only-changed
$ ansible-galaxy collection list | head -8

# /home/ops/.local/share/pipx/venvs/ansible/lib/python3.12/site-packages/ansible_collections
Collection                               Version
---------------------------------------- -------
amazon.aws                               10.1.0
ansible.netcommon                        8.1.0
ansible.posix                            2.1.0
ansible.utils                            6.0.0

$ ansible-config dump --only-changed
$
If all of these pass, the control node works. If one fails, jump to the troubleshooting table — the failure modes are predictable, and the table maps each to its fix. Optional quality-of-life: install argcomplete (shown in the pipx section) for tab completion across every ansible-* command.
Your first inventory: telling Ansible what it manages
An installed Ansible knows about nothing but localhost. An inventory fixes that — a plain text file listing hosts, grouped by role, environment, or platform. Create one:
mkdir -p ~/ansible && cd ~/ansible

cat > inventory.ini <<'EOF'
[linux]
server1.lab.local
server2.lab.local

[storage]
netapp-cluster1.lab.local

[lab:children]
linux
storage
EOF

# confirm Ansible parses it the way you meant
ansible-inventory -i inventory.ini --graph
$ ansible-inventory -i inventory.ini --graph
@all:
  |--@ungrouped:
  |--@lab:
  |  |--@linux:
  |  |  |--server1.lab.local
  |  |  |--server2.lab.local
  |  |--@storage:
  |  |  |--netapp-cluster1.lab.local
Three ideas carry the whole file. Groups ([linux], [storage]) let you target a class of machines in one word — patch linux without touching storage. The built-in all group always contains every host, no declaration needed. And [lab:children] nests groups into larger ones, which is how inventories scale from a lab file to an estate — production inventories keep this exact structure, just longer and generated from a CMDB or cloud API instead of typed by hand. From experience: put this file in Git on day one. The inventory is your infrastructure documentation, and its commit history becomes the record of when machines entered and left service.
Running your first ad-hoc command
Ad-hoc commands are one-line Ansible — no playbook, instant feedback, and the fastest way to prove connectivity to real machines. The two flags that matter: -m picks the module, -a passes its arguments. Assuming your SSH key is on the targets:
# can Ansible reach and execute on every host in the inventory?
ansible all -i inventory.ini -m ansible.builtin.ping

# run a real command on just the linux group
ansible linux -i inventory.ini -a "hostname"
$ ansible all -i inventory.ini -m ansible.builtin.ping
server1.lab.local | SUCCESS => {
    "changed": false,
    "ping": "pong"
}
server2.lab.local | SUCCESS => {
    "changed": false,
    "ping": "pong"
}
netapp-cluster1.lab.local | UNREACHABLE! => {
    "changed": false,
    "msg": "Failed to connect to the host via ssh: ...",
    "unreachable": true
}

$ ansible linux -i inventory.ini -a "hostname"
server1.lab.local | CHANGED | rc=0 >>
server1
server2.lab.local | CHANGED | rc=0 >>
server2
Read that output the way an operator does. The two Linux servers answering pong prove the entire chain — DNS, SSH, authentication, remote Python — in one line per host. The storage cluster showing UNREACHABLE is expected and correct: as Figure 01 showed, ONTAP is not managed over SSH like a Linux box — its modules run on the control node and speak the REST API, which is exactly what the playbook at the end of this guide does. When -a is given without -m, Ansible uses the command module by default — handy for hostname, uptime, and df -h across a fleet, and the gateway drug to writing the same thing as a playbook.
Understanding privilege escalation: become and sudo
Everything so far ran as your own user. Real administration — installing packages, editing system files, restarting services — needs root, and Ansible’s answer is become: a per-task or per-play escalation that wraps sudo (or doas, su, and others) rather than replacing it. The design principle is the same least-privilege rule we apply to filesystems: connect as an unprivileged user, escalate only where the task demands it.
# ad-hoc: -b escalates, --ask-become-pass prompts for the sudo password
ansible linux -i inventory.ini -b --ask-become-pass -a "whoami"
$ ansible linux -i inventory.ini -b --ask-become-pass -a "whoami"
BECOME password:
server1.lab.local | CHANGED | rc=0 >>
root
server2.lab.local | CHANGED | rc=0 >>
root
In a playbook the same escalation is declarative — set it on the play to escalate every task, or on a single task to scope it tightly (the better habit):
cat > patch.yml <<'EOF'
---
- name: Patch the linux group
  hosts: linux
  become: true            # every task in this play runs via sudo

  tasks:
    - name: Apply all pending updates
      ansible.builtin.dnf:
        name: "*"
        state: latest
EOF
Security notes from the field, in order of importance: the SSH user on managed nodes should be a dedicated automation account, not a shared login; grant it sudo for what playbooks actually do rather than blanket ALL where your policy allows the effort; and never put the become password in the playbook or inventory — prompt for it as above, or store it encrypted with Ansible Vault (covered in best practices). Escalation events land in the managed node’s auth log like any sudo call, which auditors consider a feature.
Storage automation extras: the NetApp ONTAP add-ons
A vanilla install manages servers on day one. Pointing it at storage takes two additions — this is the setup NetApp’s automation courses build, and the natural next step after our ONTAP REST API field guide, because every NetApp Ansible module is a wrapper around those same REST calls:
# 1. the ONTAP collection (skip if you installed the full "ansible" package - it ships included)
ansible-galaxy collection install netapp.ontap

# 2. the Python library the modules import on the control node
python3 -m pip install --user netapp-lib
# pipx users instead:
pipx inject ansible netapp-lib

# 3. optional but constantly useful: jq, for slicing JSON output in your shell
sudo dnf install jq      # or: sudo apt install jq / brew install jq

# 4. verify the collection and its imports resolve
ansible-doc netapp.ontap.na_ontap_volume
The sessions you should see — the collection landing, the library pulling its xmltodict and lxml dependencies, and the documentation proof that everything imports:
$ ansible-galaxy collection install netapp.ontap
Starting galaxy collection install process
Process install dependency map
Downloading https://galaxy.ansible.com/api/v3/.../netapp-ontap-23.1.0.tar.gz to ...
Installing 'netapp.ontap:23.1.0' to '/home/ops/.ansible/collections/ansible_collections/netapp/ontap'
netapp.ontap:23.1.0 was installed successfully

$ python3 -m pip install --user netapp-lib
Collecting netapp-lib
  Downloading netapp_lib-2021.6.25-py3-none-any.whl (36 kB)
Collecting xmltodict (from netapp-lib)
  Downloading xmltodict-1.0.4-py3-none-any.whl (13 kB)
Collecting lxml (from netapp-lib)
  Downloading lxml-6.1.1-cp312-cp312-manylinux_2_28_x86_64.whl (5.2 MB)
Installing collected packages: xmltodict, lxml, netapp-lib
Successfully installed lxml-6.1.1 netapp-lib-2021.6.25 xmltodict-1.0.4

$ ansible-doc netapp.ontap.na_ontap_volume | head -6
> NETAPP.ONTAP.NA_ONTAP_VOLUME    (.../netapp/ontap/plugins/modules/na_ontap_volume.py)

        Create or destroy or modify volumes on NetApp ONTAP.

OPTIONS (= indicates it is required):
If the documentation page renders, the collection and its imports resolve — you are one playbook away from declaring volumes into existence instead of scripting them.
Worked example: a NetApp lab control node on CentOS, end to end
Here is the whole thing assembled — the exact build used for NetApp’s Automating ONTAP REST APIs with Ansible training environment, including pulling the workshop playbooks from GitHub so you have something real to run. Commands first:
# RHEL-family prerequisites
sudo yum install epel-release
sudo yum install jq

# Python libraries the ONTAP modules need (use your installed interpreter)
pip3.11 install netapp-lib
pip3.11 install oslo_log

# pull the workshop playbooks to practice against
git clone https://github.com/NetApp-Learning-Services/STRSW-ILT-RSTAN

# lab-environment fix: ensure collection directories are traversable
chmod -R +x /root/.ansible/collections
And the real session — including what re-runs and upgrade notices look like in the wild:
$ pip3.11 install netapp-lib
Requirement already satisfied: netapp-lib in /usr/local/lib/python3.11/site-packages (2021.6.25)
Requirement already satisfied: xmltodict in /usr/local/lib/python3.11/site-packages (from netapp-lib) (1.0.4)
Requirement already satisfied: lxml in /usr/local/lib/python3.11/site-packages (from netapp-lib) (6.1.1)
Requirement already satisfied: six in /usr/local/lib/python3.11/site-packages (from netapp-lib) (1.16.0)
WARNING: Running pip as the 'root' user can result in broken permissions and
conflicting behaviour with the system package manager. It is recommended
to use a virtual environment instead: https://pip.pypa.io/warnings/venv

[notice] A new release of pip is available: 23.2.1 -> 26.1.2
[notice] To update, run: pip install --upgrade pip

$ pip install --upgrade pip
Collecting pip
  Downloading pip-26.1.2-py3-none-any.whl (1.8 MB)
Installing collected packages: pip
  Attempting uninstall: pip
    Found existing installation: pip 23.2.1
    Uninstalling pip-23.2.1:
      Successfully uninstalled pip-23.2.1
Successfully installed pip-26.1.2

$ git clone https://github.com/NetApp-Learning-Services/STRSW-ILT-RSTAN
Cloning into 'STRSW-ILT-RSTAN'...
remote: Enumerating objects: done.
remote: Counting objects: 100%, done.
Receiving objects: 100%, done.
Resolving deltas: 100%, done.
Three honest notes on that transcript. The Requirement already satisfied lines mean this was a re-run — pip confirming everything is in place, not an error. The root warning appears because training labs run as root for convenience; on your own jump host, prefer the pipx or --user patterns from earlier and the warning never appears. And the chmod -R +x on the collections directory is a lab-environment fix for missing execute bits on directories — scoped to that path, not a permissions free-for-all. With the repository cloned, cd STRSW-ILT-RSTAN and you have a graded set of real ONTAP playbooks to run against a lab cluster.
Real-world example: your first NetApp ONTAP playbook
Here is where the install pays off. Storage teams automate for the same reasons server teams do — volume provisioning that takes minutes instead of a ticket cycle, snapshot policies that are identical on every SVM because the same playbook created them, and configuration evidence you can regenerate on demand before and after every change window. The right first playbook is read-only: gather cluster information. It proves the whole chain — collection, library, credentials, REST connectivity — while being incapable of breaking anything.
# the playbook - read-only cluster discovery over the ONTAP REST API
cat > ontap_info.yml <<'EOF'
---
- name: Gather ONTAP cluster information
  hosts: localhost          # API modules run on the control node (see Figure 01)
  gather_facts: false

  vars_files:
    - ontap_vars.yml        # hostname + credentials, kept out of the playbook

  tasks:
    - name: Collect cluster, SVM, and volume information
      netapp.ontap.na_ontap_rest_info:
        hostname: "{{ ontap_hostname }}"
        username: "{{ ontap_username }}"
        password: "{{ ontap_password }}"
        https: true
        validate_certs: true
        gather_subset:
          - cluster
          - svm/svms
          - storage/volumes
      register: ontap

    - name: Show what came back
      ansible.builtin.debug:
        var: ontap.ontap_info["cluster"]
EOF

# the variables file - then encrypt it so credentials never sit in plain text
cat > ontap_vars.yml <<'EOF'
ontap_hostname: cluster1.lab.local
ontap_username: admin
ontap_password: changeme_in_vault
EOF
ansible-vault encrypt ontap_vars.yml

# run it
ansible-playbook ontap_info.yml --ask-vault-pass
$ ansible-playbook ontap_info.yml --ask-vault-pass
Vault password:

PLAY [Gather ONTAP cluster information] ****************************************

TASK [Collect cluster, SVM, and volume information] ****************************
ok: [localhost]

TASK [Show what came back] *****************************************************
ok: [localhost] => {
    "ontap.ontap_info[\"cluster\"]": {
        "name": "cluster1",
        "version": {
            "full": "NetApp Release 9.14.1P6: ..."
        }
    }
}

PLAY RECAP *********************************************************************
localhost    : ok=2    changed=0    unreachable=0    failed=0    skipped=0
Walking through the choices, because each one is a habit worth keeping. hosts: localhost is the architecture lesson made concrete — the module runs on the control node and speaks HTTPS to the cluster; the cluster is never an SSH target. gather_facts: false skips fact collection that is meaningless for an API task. The credentials live in a separate vars_files entry encrypted with Ansible Vault — the playbook itself can sit in a Git repository with nothing sensitive in it. register captures the API response so later tasks (or a report template) can use it, and changed=0 in the recap confirms the run was pure read. One naming note: older NetApp material uses na_ontap_info, which rides the legacy ZAPI interface; na_ontap_rest_info is its REST-era successor and the one to standardize on — the payloads it returns are the same objects you would fetch by hand in our ONTAP REST API guide.
From here the write-side modules follow the identical pattern: na_ontap_volume declares a volume into existence, na_ontap_snapshot_policy standardizes data protection, and because every module is idempotent, re-running the playbook against a compliant cluster changes nothing — which is precisely what makes scheduled enforcement runs safe.
Six install pitfalls, so you can skip them
- Trying to run the control node on native Windows. Not supported — use WSL, which works fully and counts as UNIX-like.
- Mixing install methods. An apt Ansible plus a pip Ansible on one host means PATH order silently decides which runs. Pick one method per machine; remove the other.
- Fighting PEP 668 with
--break-system-packages. The OS marked its Python externally managed for a reason. pipx exists precisely so you never need that flag for applications. - Missing PATH after
pip install --user. The commands land in~/.local/bin; ifansibleis “not found,” that is the first place to look. - Assuming the distro package is current. LTS distros freeze versions for years; collections increasingly demand newer ansible-core. Check
ansible --versionagainst what your collections require. - Installing module dependencies into the wrong Python. Libraries like
netapp-libmust live in the environment Ansible actually runs from —pipx injector the same venv, not a random system pip.
Common problems and fixes: the first-week troubleshooting table
Nearly every failure in the first week of running Ansible falls into one of seven buckets, and each announces itself with a recognizable message. Match the symptom, apply the fix:
| Symptom you see | Likely cause | Resolution |
|---|---|---|
UNREACHABLE! ... Failed to connect to the host via ssh |
DNS, firewall, or SSH service — Ansible never got a connection | Prove the layer below first: ssh user@host by hand. If that fails, it is a network/SSH problem, not an Ansible one. Fix order: DNS → firewall → sshd. |
Permission denied (publickey,password) |
SSH reachable, authentication failing — wrong user or key not deployed | Confirm the remote user (-u flag or ansible_user in inventory), then ssh-copy-id user@host to deploy your key. |
/usr/bin/python3: not found or interpreter discovery warnings |
Managed node missing Python, or it lives at a nonstandard path | Install Python on the target, or set ansible_python_interpreter=/usr/bin/python3.11 for that host in inventory. |
No inventory was parsed / provided hosts list is empty |
Ansible cannot find or read your inventory file | Pass it explicitly with -i inventory.ini, or set the path once in ansible.cfg. Verify parsing with ansible-inventory --graph. |
ansible-galaxy collection install fails or hangs |
Proxy/firewall blocking galaxy.ansible.com, or ansible-core too old for the collection | Test reachability with curl -sI https://galaxy.ansible.com; set proxy variables if needed. Compare ansible --version against the collection’s minimum core requirement — distro-package installs fail here most. |
Missing sudo password |
Task escalated with become but no password supplied and no NOPASSWD rule | Add --ask-become-pass to the run, or configure the automation account’s sudoers entry to match how you intend to run. |
ModuleNotFoundError: No module named 'netapp_lib' (or any import error inside a task) |
The Python library was installed into a different environment than Ansible runs from | Check ansible --version → python version line, then install the library into exactly that environment: pipx inject ansible netapp-lib or the matching python3 -m pip. |
The meta-rule behind the table: isolate the layer before touching anything. Connectivity problems live below Ansible (DNS, SSH, firewall), environment problems live beside it (PATH, interpreters, libraries), and only logic problems live inside the playbook. Engineers who debug in that order fix in minutes what trial-and-error stretches into afternoons — it is the same layer-isolation discipline we apply to SAN fabric incidents.
Best practices for production environments
Five habits separate estates where automation compounds from estates where it decays. None is optional once playbooks touch production:
- SSH keys, not passwords. Generate a dedicated key for automation and deploy it to every managed node — password prompts and fleet automation do not mix, and a distinct key makes the automation account’s activity auditable in auth logs.
- Least privilege everywhere. A dedicated automation user on managed nodes; become scoped per task, not blanket; sudoers entries that reflect what playbooks actually run. The blast radius of a compromised control node is defined by these choices, so make them deliberately.
- Version control or it does not exist. Playbooks, inventory, and configuration belong in Git. The diff is your change record, the pull request is your review gate, and a bad change rolls back with a revert instead of an archaeology session.
- Secrets in Ansible Vault, never in plain text. Encrypt variable files holding credentials (
ansible-vault encrypt ontap_vars.yml, as in the ONTAP example) so repositories and backups never contain a readable password. Vault password handling itself then becomes the one secret to manage carefully. - Test before you trust. Run playbooks with
--check --diffto preview changes without making them, point them at a lab or canary group first, and only then at production. Idempotency makes re-runs safe; check mode makes first runs safe.
# the two commands behind the first and last habits
ssh-keygen -t ed25519 -C "ansible-automation" -f ~/.ssh/ansible_ed25519
ssh-copy-id -i ~/.ssh/ansible_ed25519.pub user@server1.lab.local

# preview a playbook's changes without applying anything
ansible-playbook patch.yml --check --diff
Frequently asked questions
Q01
What is Ansible and what is it used for?
Ansible is an open-source automation engine that describes the desired state of infrastructure in YAML playbooks and makes systems match it. Enterprises use it for configuration management, patching, application deployment, network automation, storage automation (including NetApp ONTAP), cloud provisioning, and compliance enforcement — one tool, one language, across all of them.
Q02
Is Ansible free?
Yes — the community Ansible covered in this guide is open source (GPL) and free to use at any scale, including production. Red Hat sells the Ansible Automation Platform on top of it, which adds a web console, RBAC, certified content, and support; the engine you install here is the same one underneath.
Q03
Does Ansible require agents on managed servers?
No. Ansible is agentless: managed Linux nodes need only Python and an SSH account with a POSIX shell, Windows targets need PowerShell remoting, and many network and storage devices need nothing on-device at all — their modules run on the control node against the device API.
Q04
What operating systems does Ansible support?
As a control node: nearly any UNIX-like OS with a recent Python 3 — Red Hat family, Debian, Ubuntu, macOS, the BSDs — and Windows only inside WSL, never natively. As managed targets: any Linux/UNIX reachable over SSH, Windows via PowerShell remoting, plus network and storage platforms through their collections.
Q05
What is the difference between ansible and ansible-core?
ansible-core is the minimal engine with built-in modules; ansible bundles the engine plus a large curated set of community collections. Start with ansible for convenience; prefer ansible-core plus pinned collections for controlled production estates.
Q06
Do I need root to install or run Ansible?
No. pipx and pip --user install without root, and Ansible runs entirely as a regular user. Privilege on managed nodes is handled per task with become/sudo — scoped where you need it, not baked into the install.
Q07
Which Python version does Ansible need?
A recent Python 3 on the control node — the exact floor moves with each ansible-core release, so check the official support matrix for the version you are installing. Managed nodes are far more forgiving; they only need a Python the modules can execute under.
Q08
Can Ansible manage NetApp ONTAP storage?
Yes. The netapp.ontap collection provides modules for volumes, SVMs, exports, snapshots, and cluster information, each driving the ONTAP REST API from the control node — the cluster needs nothing installed. You need the collection plus the netapp-lib Python library in Ansible’s environment; the storage section above shows the setup and a complete first playbook.
Q09
How do I update Ansible?
With the same method that installed it — never a different one. pipx: pipx upgrade --include-injected ansible. pip: python3 -m pip install --upgrade --user ansible. OS packages: your package manager’s normal update. Then re-run ansible --version to confirm, and check that your collections still meet the new core’s requirements.
Q10
How do I verify Ansible installed correctly?
Three commands: ansible --version (engine and interpreter), ansible-galaxy collection list (available collections), and ansible localhost -m ansible.builtin.ping — which executes a real task through the full runtime and should answer "ping": "pong". If all three pass, the control node works.
Where this leaves you
You now have what most “install Ansible” guides stop short of: a control node installed by a method that survives upgrades, verified end to end, an inventory under version control, your first ad-hoc commands and privilege escalation done correctly — and a working ONTAP playbook proving the same engine reaches your storage. The payoff compounds from here. Every task you move from hands to playbooks gains three properties at once: it runs the same way every time, it runs at fleet speed, and it leaves an audit trail — consistency, velocity, and evidence, which is the entire business case for infrastructure automation in one sentence.
The natural next steps, in order: put ~/ansible in a Git repository today, while it is small; convert the ad-hoc commands you actually ran this week into your first real playbooks; add the collections for the platforms you operate (netapp.ontap, cisco.ios, community.vmware); and adopt the production habits above before the first playbook touches anything that matters. In enterprise environments, the pattern we see repeatedly: teams that automate patching first earn the credibility to automate provisioning, then compliance — and within a year the playbook repository is the most accurate description of the estate that exists.
Standing up automation across a multi-OEM estate?
A control node is an afternoon; an automated estate is an operating model. WUC engineers build and run both — Ansible against NetApp ONTAP, Cisco fabrics, and the server platforms in between, as an automation consultant, infrastructure maintenance provider, and managed services partner.
Prefer to read first? See managed services and post-OEM storage maintenance.
References
- Ansible project. Installing Ansible. The authoritative installation guide, including node requirements and the pipx/pip procedures.
- Ansible project. Installing Ansible on Specific Operating Systems. Distro-package guidance per platform.
- NetApp. ONTAP Automation Documentation. The REST API and client-library foundation under the netapp.ontap collection.
- NetApp Learning Services. STRSW-ILT-RSTAN — Automating ONTAP REST APIs with Ansible. The public workshop repository used in the worked example.
Find our field guides faster in Google. Add WUC Technologies as a preferred source and our engineering guides carry a “preferred” badge in your Search results, AI Overviews, and AI Mode.
Managing ONTAP Using the REST API: An Engineer’s Field Guide
The ticket says: “report the size and utilisation of every volume on the cluster, weekly.” You could click through System Manager and copy numbers into a spreadsheet every Friday — or you could ask the cluster itself, in one line, and let a script do Fridays forever. That second path runs through the ONTAP REST API, and learning it is the single highest-leverage skill jump a storage engineer can make. This guide takes you from zero to creating volumes programmatically, with every concept illustrated by a diagram, a real request, and a real response.
The fundamentals of the ONTAP REST API for engineers who have used System Manager or the ONTAP CLI but never touched the API: what REST means in practice, how to authenticate, how to read responses and status codes, and worked examples — listing volumes, creating one, resizing it, and tracking the background job — in curl and Python. Applies to ONTAP 9.6 and later, where the REST API is the standard management interface.
Audience: storage and infrastructure engineers, NOC analysts moving into automation, and anyone who inherits a NetApp estate and a pile of repetitive tickets. Assumes you can open a terminal; assumes no programming background.
The restaurant analogy: how to think about an API
Before any syntax, build the picture. You are seated at a restaurant. You want food. You do not walk into the kitchen, find a pan, and start cooking — you would be thrown out, and rightly so. Instead, you read the menu, give your order to the waiter, and the waiter carries it to the kitchen. The kitchen does the work. The waiter returns with your dish — or with a polite explanation of why you cannot have it.
That is an API. The waiter is a defined, disciplined intermediary between you and a system you are not allowed to touch directly. You ask in an agreed format; you receive answers in an agreed format; what happens inside the kitchen is not your problem.
Figure 01 · The restaurant: you never enter the kitchen
Now relabel every actor and the whole of ONTAP REST falls into place. Your script is the customer. The cluster is the kitchen. The REST API is the waiter. The menu — the complete list of what you may ask for and exactly how to phrase it — is the cluster’s own documentation page at /docs/api. And the order ticket the kitchen pins up for dishes that take a while? Hold that thought — it becomes the job UUID when we get to asynchronous operations.
Figure 02 · The same picture, relabeled for ONTAP
What a REST API is — in plain language
An API (application programming interface) is a way for software to ask other software to do things — the waiter, formalised. A REST API is a specific, very common style of API that works over HTTPS, the same protocol your browser uses. That detail matters more than it sounds: it means anything that can make a web request — curl, Python, PowerShell, Ansible, a monitoring platform — can manage your storage, with no agent and no special client software.
Every NetApp ONTAP cluster running 9.6 or later ships with a REST API built in, listening on the same cluster management address you already use for System Manager. In fact, System Manager itself is a REST API client — every button you click in the UI becomes one of the API calls you are about to learn.
Three building blocks make up every exchange, and each maps straight back to the restaurant:
- The URI — which dish you are pointing at on the menu.
/api/storage/volumesmeans “the volumes.” The noun. - The HTTP method — what you want done with it.
GETreads,POSTcreates,PATCHmodifies,DELETEremoves. The verb. - JSON — the agreed phrasing for orders and answers. Human-readable
"key": "value"pairs, nothing more exotic than that.
If you remember one sentence from this section: a REST call is a verb applied to a noun, with details in JSON.
Figure 03 · The four verbs, at the table and on the cluster
Anatomy of a call
Here is a complete request, labeled piece by piece. Do not run it yet — read it:
curl -X GET "https://cluster1.corp.example.com/api/storage/volumes" \
     -u apireader:SuperSecret1! \
     -H "accept: application/json"

#  -X GET .............. the verb: read, change nothing
#  https://cluster1.... the cluster management address (same one System Manager uses)
#  /api/storage/volumes the resource: all volumes (a "collection")
#  -u user:password .... basic authentication - an ONTAP account, checked by RBAC
#  -H accept: .......... "answer me in JSON, please"
The URI reads like a postal address for data — each segment narrows the destination:
Figure 04 · A URI is an address, read left to right
ONTAP groups its resources into categories you will recognise from System Manager’s menu: storage (disks, aggregates, volumes, LUNs, snapshots, qtrees, quotas), svm, networking, protocols (NFS, SMB, S3, SAN), cluster (nodes, jobs, licensing, schedules), security, and snapmirror, among others. Guessing a path from this pattern works surprisingly often — and when it does not, the cluster documents itself: browse to https://<cluster-mgmt>/docs/api and ONTAP serves the menu — a complete, interactive reference for every endpoint, generated from the exact software version you are running. Bookmark it; it is the authoritative answer to “what fields does this take?”
When the request needs to carry information — a POST creating something — it travels in four layers, like a properly written order slip:
Figure 05 · Anatomy of a write request: the order slip
Your first call: ask the cluster who it is
The safest possible first call is a read against the cluster itself:
curl -X GET "https://cluster1.corp.example.com/api/cluster" \
     -u apireader:SuperSecret1! -H "accept: application/json"

{
  "name": "cluster1",
  "uuid": "5f7f9a4e-2c1d-11ee-a7b2-00a098d39e12",
  "version": {
    "full": "NetApp Release 9.14.1P2",
    "generation": 9,
    "major": 14,
    "minor": 1
  },
  "management_interfaces": [
    { "name": "cluster_mgmt", "ip": { "address": "192.168.0.101" } }
  ]
}
That JSON response is worth a slow read. Notice the uuid: every object in ONTAP — cluster, volume, SVM, LUN — has one, and it is how the API names individual things unambiguously. Names can be changed and reused; UUIDs cannot. You will spend a lot of your API life looking up a UUID with one call and using it in the next.
On a lab cluster, curl will refuse the connection because the cluster presents a self-signed TLS certificate. The internet will tell you to add -k (or verify=False in Python) to skip verification. In a lab, fine. In production, that habit disables the protection that proves you are talking to your cluster and not something pretending to be it — while your admin credentials are in the request. The production-grade fix takes five minutes: export the cluster certificate, hand it to curl with --cacert or to Python via verify="/path/to/cluster1.pem", and never type -k on a production fabric again.
Authentication: who you are, and what you may touch
Every request carries credentials — there is no “session login” like the CLI. The straightforward method is HTTP basic authentication: an ONTAP username and password sent (TLS-encrypted) with each call, exactly what -u does in the examples above. ONTAP also supports certificate-based authentication, where a client certificate replaces the password entirely — the right choice for unattended scripts once you graduate from experimenting.
What that account is allowed to do is governed by the same role-based access control (RBAC) as the CLI and System Manager. In restaurant terms: identification gets you a table, but the wine list still depends on whose name the reservation is under. This is your safety net, and you should use it from day one: create a dedicated read-only account for learning, and you become physically unable to break anything while you explore.
cluster1::> security login create -user-or-group-name apireader \
    -application http -authentication-method password -role readonly
One account, http application, built-in readonly role. Every GET in this guide works under it; every POST, PATCH, and DELETE is refused with a 403 — which, while you are learning, is a feature.
Reading the cluster’s answers: HTTP status codes
Every response begins with a three-digit status code — the waiter’s tone of voice before you even look at the plate. Reading them well separates an engineer who troubleshoots from one who retries the same failing call.
Figure 06 · Status codes as the waiter’s replies
| Code | Meaning | What it tells you to do |
|---|---|---|
| 200 | Success (no new object created) | Read your data and carry on |
| 201 | Object created | The create finished synchronously — done |
| 202 | Accepted — background job started | The work is not done yet; poll the job (next section) |
| 400 | Bad request | Your JSON has a wrong value, a typo’d field, or a missing required field — reread the request, not the cluster |
| 401 | Authentication failed | Wrong username or password — identity problem |
| 403 | Authorisation failed | Right user, insufficient role — permission problem |
| 404 | Resource does not exist | Wrong UUID or wrong path — look the resource up again |
| 409 | Conflict | Something already exists or is in the way (duplicate name, busy resource) |
| 500 | Internal server error | The cluster’s problem, not your request — check EMS logs, retry cautiously |
Collections, UUIDs, and asking for only what you need
A URI without a UUID names a collection (“all volumes”); with a UUID appended it names one object (a singleton). Collection responses arrive in a standard envelope — a records array plus a num_records count:
Figure 07 · Collection vs singleton — the menu page vs one dish
curl -s "https://cluster1/api/storage/volumes?fields=name,size,svm.name" \
     -u apireader:SuperSecret1!

{
  "records": [
    { "uuid": "1d7e8c2a-...", "name": "svm1_root", "size": 1073741824,
      "svm": { "name": "svm1" } },
    { "uuid": "9b2f4e11-...", "name": "vol_finance", "size": 107374182400,
      "svm": { "name": "svm1" } }
  ],
  "num_records": 2
}
Two details in that call do a lot of work. First, ?fields=name,size,svm.name — by default ONTAP returns only a minimal set of attributes, so you ask for what you need (or fields=* for everything, at a cost in response size). Second, sizes come back in bytes — 107374182400 is 100 GiB. Your scripts will divide by 1073741824 more often than you expect.
Collections also filter directly in the query string. Every volume in one SVM larger than 50 GiB, sorted by size, biggest first:
/api/storage/volumes?svm.name=svm1&size=>53687091200&order_by=size%20desc
That one-line filter replaces a page of script logic — let the cluster do the filtering and your code stays small. The same pattern powers monitoring: /api/cluster/metrics?interval=1h and the per-volume /api/storage/volumes/{uuid}/metrics endpoints return IOPS, throughput, and latency series ready for dashboards — the data layer behind infrastructure performance monitoring.
Making your first change: creating a volume
Reads behind you, RBAC understood — time to place a real order. Switch to an account with an appropriate role, and tell the cluster the three things a volume needs: a name, a home SVM, and a size (the aggregate is optional — ONTAP picks one if you stay silent):
curl -X POST "https://cluster1/api/storage/volumes" \
     -u apiadmin:EvenMoreSecret2@ \
     -H "accept: application/json" -H "content-type: application/json" \
     -d '{
           "name": "vol_apitest",
           "svm":  { "name": "svm1" },
           "size": "100GB",
           "comment": "created via REST - training"
         }'

HTTP/1.1 202 Accepted
{
  "job": {
    "uuid": "f1a2b3c4-2d1e-11ee-a7b2-00a098d39e12",
    "_links": { "self": { "href": "/api/cluster/jobs/f1a2b3c4-..." } }
  }
}
Note what did not happen: the cluster did not say “volume created.” It said 202 — “order accepted, the kitchen is on it” — and handed you an order ticket: the job UUID. That is the asynchronous pattern, and it is the part of ONTAP REST that catches every newcomer.
Asynchronous jobs: the two-second rule and the order ticket
Think about how the restaurant actually works. Ask the waiter for the specials and the answer comes back immediately — no kitchen involved. Order a glass of water and it arrives in seconds. But order the forty-minute roast and the waiter does not stand frozen at your table while it cooks — you get a ticket on the table, the kitchen works, and you check back. ONTAP makes exactly this decision, with a threshold of about two seconds:
Figure 08 · Synchronous vs asynchronous — water vs the roast
The discipline: after any 202, poll the job until it reaches a terminal state.
curl -s "https://cluster1/api/cluster/jobs/f1a2b3c4-2d1e-11ee-a7b2-00a098d39e12" \
     -u apiadmin:EvenMoreSecret2@

{ "uuid": "f1a2b3c4-...", "description": "POST /api/storage/volumes",
  "state": "success", "end_time": "2026-06-11T14:09:21+00:00" }
state walks through queued → running → success (or failure, with a message explaining why). A script that fires a POST and exits without polling has not deployed anything — it has expressed a wish. Check the job, then verify the resource exists with a GET. That fire-poll-verify rhythm is the habit that separates automation you can trust from automation you hope about.
Modifying and deleting: PATCH and DELETE
Changes to an existing object go to its singleton URI — UUID required — with only the fields you are changing in the body. Growing our volume to 200 GB:
curl -X PATCH "https://cluster1/api/storage/volumes/9b2f4e11-..." \
     -u apiadmin:EvenMoreSecret2@ -H "content-type: application/json" \
     -d '{ "size": "200GB" }'
Deletion is the same shape with no body: DELETE /api/storage/volumes/9b2f4e11-.... Treat DELETE with CLI-grade respect — it is a one-line, irreversible operation, which is exactly why your learning account should not be able to run it, and why production scripts that delete things belong under change control with a human approving the list of UUIDs first.
Engineers coming from the ONTAP CLI sometimes treat the API as foreign territory. It is the same territory with different signposts: volume show is GET /api/storage/volumes, volume modify is a PATCH, vserver delete is a DELETE on /api/svm/svms/{uuid}. When you know the CLI command but not the endpoint, the mapping table below — and the cluster’s own /docs/api — bridge the gap in seconds. Everything you know about ONTAP objects still applies; only the syntax changed.
The same calls from Python
curl proves concepts; scripts do Fridays. The requests library is the standard way Python speaks HTTP, and the translation from curl is nearly mechanical:
import requests

CLUSTER = "https://cluster1.corp.example.com"
AUTH    = ("apireader", "SuperSecret1!")
CA      = "/etc/ssl/certs/cluster1.pem"   # exported cluster cert - no verify=False

r = requests.get(
    f"{CLUSTER}/api/storage/volumes",
    params={"fields": "name,size,svm.name"},
    auth=AUTH, verify=CA,
)
r.raise_for_status()                       # turns 4xx/5xx into a visible error

for vol in r.json()["records"]:
    gib = vol["size"] / 1024**3
    print(f'{vol["svm"]["name"]:>10}  {vol["name"]:<24} {gib:8.1f} GiB')
Twelve lines, and the Friday spreadsheet writes itself. When your scripts grow past one file, NetApp’s official Python client library (pip install netapp-ontap) wraps the raw HTTP in storage-shaped objects and handles the order tickets for you:
from netapp_ontap import HostConnection
from netapp_ontap.resources import Volume

with HostConnection("cluster1.corp.example.com",
                    username="apiadmin", password="EvenMoreSecret2@",
                    verify="/etc/ssl/certs/cluster1.pem"):
    vol = Volume(name="vol_apitest2", svm={"name": "svm1"}, size="100GB")
    vol.post(poll=True)        # poll=True waits for the async job - the 202 dance, handled
    print(vol.uuid, "created")
PowerShell engineers get the identical experience through Invoke-RestMethod — same URIs, same JSON, same status codes. The protocol knowledge transfers untouched across every tool.
The CLI-to-REST translation table
| You know this CLI command | REST equivalent | Verb |
|---|---|---|
volume show |
/api/storage/volumes |
GET (collection) |
volume show vol1 |
/api/storage/volumes/{uuid} |
GET (singleton) |
volume create |
/api/storage/volumes |
POST |
volume modify |
/api/storage/volumes/{uuid} |
PATCH |
aggr create |
/api/storage/aggregates |
POST |
vserver show |
/api/svm/svms |
GET |
vserver delete |
/api/svm/svms/{uuid} |
DELETE |
snapshot create |
/api/storage/volumes/{uuid}/snapshots |
POST |
statistics show |
/api/cluster/metrics and per-object /metrics |
GET |
Beyond raw calls: where Ansible fits
Once the API makes sense, the next rung is declarative automation. Ansible’s netapp.ontap collection wraps these same REST endpoints in idempotent modules: instead of scripting “create the volume, poll the job,” a playbook states “a 100 GB volume named vol_apitest exists on svm1” and Ansible makes it so — creating it if absent, leaving it untouched if present, reporting what changed either way. Idempotency is what turns scripts into infrastructure you can re-run safely, and it is the natural second course after this one. The protocol fluency you built here is exactly what lets you debug a playbook when a module fails: under every Ansible error is one of the status codes you can now read.
Figure 09 · The skills ladder — every rung uses the one below it
This skills ladder — UI to CLI to REST to declarative automation — is the same path our engineers apply across post-OEM storage maintenance estates, where one team manages NetApp alongside Dell EMC and IBM platforms and the API is what makes multi-vendor scale survivable.
Six beginner pitfalls, so you can skip them
- Treating 202 as “done.” It is the order ticket, not the dish. Poll the job. Verify the resource. Every time.
- Confusing 401 with 403. 401 is who-you-are (credentials); 403 is what-you-may (role). They route to different fixes and different ticket queues.
- Forgetting
fields=. The default response is deliberately minimal; if an attribute you expected is “missing,” you probably did not ask for it. - Hand-counting bytes. Sizes are bytes in responses; write the GiB conversion once, in one function, and reuse it.
- Normalising
-k/verify=False. Lab habit, production liability. Export the cluster certificate and verify properly. - Learning with an admin account. A read-only RBAC account makes your exploration phase consequence-free. Privilege comes later, scoped to what the script actually does.
Work these examples against a lab cluster — NetApp’s Lab on Demand, an ONTAP Select instance, or a simulator — and within an afternoon the API stops being an abstraction and becomes what it actually is: the fastest tool in your kit for every question that starts with “across all our volumes…” And when the estate grows past what afternoons can cover — or the NetApp gear ages past OEM support while the workloads stay — that is what WUC engineering and managed services are for.
Frequently asked questions
Q01
Does the ONTAP REST API replace ZAPI?
Yes. REST is the strategic successor to ONTAPI (ZAPI), the proprietary interface used before ONTAP 9.6. New automation should target REST exclusively; NetApp publishes an ONTAPI-to-REST mapping to migrate existing ZAPI scripts, and ONTAPI is on a deprecation path in current releases.
Q02
Which ONTAP versions support the REST API?
ONTAP 9.6 and later carry the full REST API as the standard management interface, and every subsequent release expands endpoint coverage. The cluster documents exactly what your version supports at https://<cluster-mgmt>/docs/api — generated from the running software, so it never lies about availability.
Q03
How do I authenticate to the ONTAP REST API?
Two methods: HTTP basic authentication — an ONTAP account and password sent TLS-encrypted with each request — or certificate-based authentication, where a client certificate replaces the password entirely. Authorization is governed by the same RBAC roles as the CLI; start with a read-only account and scope privilege to what each script actually does.
Q04
Is the ONTAP REST API enabled by default?
Yes. On ONTAP 9.6 and later the REST API listens on the cluster management LIF out of the box — the same address System Manager uses, because System Manager is itself a REST client. There is no separate enable step; access control happens through accounts and RBAC roles, not a feature switch.
Q05
Can I manage volumes through the REST API?
Fully. /api/storage/volumes supports the complete lifecycle — create, resize, modify, snapshot, and delete — which is exactly what this guide demonstrates end to end. The same pattern extends to aggregates, LUNs, SVMs, exports, and quotas: one verb, one URI, details in JSON.
Need help automating NetApp infrastructure?
The patterns in this guide scale from one script to an estate — and that is where WUC works daily: as a NetApp maintenance provider for AFF and FAS inside and outside OEM support, an ONTAP automation consultant, a storage modernization partner, and a managed storage services provider across multi-OEM data centers.
Prefer to read first? See post-OEM storage maintenance and managed services.
References
- NetApp. ONTAP Automation Documentation. The official hub for REST API, workflows, and client libraries.
- NetApp. Your First ONTAP REST API Call. The vendor’s own getting-started walk-through.
- NetApp. RBAC Security for the REST API. Role-based access control as it applies to API accounts.
- NetApp. netapp-ontap Python Client Library. PyPI package and documentation.
Find our field guides faster in Google. Add WUC Technologies as a preferred source and our engineering guides carry a “preferred” badge in your Search results, AI Overviews, and AI Mode.
How to Set Up a Brand New Cisco Layer 3 Switch
It is a familiar Monday-morning ticket: users in Finance can reach their own file share but nothing in Engineering. The printers in VLAN 30 answer pings from the IT subnet but not from the floor they actually sit on. Every device can reach its local gateway — and nothing beyond it. The Layer 2 switching is working exactly as designed; what the network is missing is something to route between those VLANs. That is the job of a Cisco Layer 3 switch, and getting one from sealed box to production-ready is what this guide covers.
In a modern enterprise network, inter-VLAN routing is not an edge case — it is most of the traffic. Segmentation by department, function, and security zone means almost every meaningful flow crosses a VLAN boundary: workstation to server, phone to call manager, badge reader to security appliance. Pushing all of that through a router-on-a-stick or, worse, a firewall that was never sized for east-west traffic creates a bottleneck the business feels every day. A correctly configured Layer 3 switch routes that traffic in hardware at wire speed — and a misconfigured one produces exactly the Monday-morning ticket above.
A practical setup procedure for Cisco Catalyst 9000-series Layer 3 switches running IOS-XE — focused on the C9300 and C9500. Covers the day-zero steps that most setup guides skip: Plug-and-Play disable, Smart Licensing registration, management VRF isolation, SVI routing, HSRP gateway redundancy, access-port hardening, and stack configuration.
Audience: network engineers and IT directors deploying or refreshing Catalyst 9000 infrastructure in enterprise campus environments. Assumes familiarity with IOS-XE CLI, VLAN concepts, and basic routing.
The 5-minute version
Ten steps from sealed box to routing production traffic. Each links to the full procedure below.
- Disable PnP (unless Catalyst Center manages it)
- Hostname, NTP, scrypt admin user
- Register Smart Licensing — day one
- OOB management on Gi0/0 + SSH with ACL
- Enable ip routing, build VLANs and SVIs
- Trunks with explicit allowed-VLAN lists
- Static default or OSPF with BFD
- HSRP gateway pair, hosts on the virtual IP
- Harden: snooping, DAI, SNMPv3, syslog
- Verify with the six commands, back up config
Take it to the data center: the complete day-zero procedure as a printable 2-page checklist — every phase, every checkbox, no scrolling.
What is a Layer 3 switch?
A Layer 3 switch is a network switch that forwards traffic by MAC address within a VLAN (Layer 2) and routes traffic by IP address between VLANs (Layer 3), performing both functions in dedicated switching hardware rather than a general-purpose CPU. Cisco documentation often calls the same device a multilayer switch; on the Catalyst 9000 family, Layer 3 capability is native to the platform.
The distinction that matters operationally is where the forwarding decision happens. A traditional router receives a packet, interrupts a CPU, performs a route lookup in software or a software-assisted path, rewrites the header, and forwards. A Catalyst Layer 3 switch programs its routing table, ARP adjacencies, and ACLs into a forwarding ASIC (the UADP chip on the Catalyst 9000 family) via OSI Layer 2/Layer 3 lookup tables built by Cisco Express Forwarding (CEF). Once programmed, the ASIC routes packets at line rate with the CPU uninvolved — the same five-stage hardware path shown in Figure 03 later in this guide. That is why a 1U Catalyst 9300 can route hundreds of gigabits of inter-VLAN traffic while a software router at the same price point saturates in the low single digits.
The trade-off: a Layer 3 switch is optimized for high-density Ethernet and fast simple forwarding. It is not the right tool for WAN terminations, large-scale NAT, full Internet BGP tables, or per-flow services like stateful inspection — that remains router and firewall territory.
| Feature | Layer 2 switch | Layer 3 switch | Router |
|---|---|---|---|
| Forwarding decision | MAC address table | MAC table + hardware IP routing (CEF/ASIC) | IP routing table (software or hardware-assisted) |
| Inter-VLAN routing | No — requires external device | Yes — native, wire-speed via SVIs | Yes — via subinterfaces (router-on-a-stick) |
| Routing protocols | None | Static, OSPF, EIGRP, BGP (license-dependent) | Full suite, large table capacity |
| Throughput profile | Line rate L2 | Line rate L2 + L3 (ASIC) | Platform-bound; far lower per dollar |
| Latency | Microseconds | Microseconds | Tens of microseconds to milliseconds |
| NAT / stateful services | No | Limited or none | Yes |
| WAN interfaces | No | No (Ethernet only) | Yes (fiber handoffs, LTE, legacy circuits) |
| Port density | High | High (24-48 ports + uplinks per RU) | Low |
| Typical placement | Access layer | Access, distribution, campus core | WAN edge, Internet edge, branch perimeter |
When to use a Layer 3 switch
Deploy a Layer 3 switch wherever routed traffic stays on Ethernet and stays inside your administrative domain:
- Campus networks — the canonical case. SVIs on the distribution or collapsed-core switch act as the default gateway for every user VLAN; traffic between departments never touches a router.
- Enterprise branch offices — a single Catalyst 9300 can be the access switching, the inter-VLAN router, and the LAN side of the WAN handoff, with one static default route toward the branch router or SD-WAN appliance.
- Data centers — top-of-rack and end-of-row L3 switching keeps server-to-server (east-west) traffic in hardware. At scale this becomes spine-leaf on Nexus, a different platform with a different procedure, but the principle is identical.
- Distribution-layer deployments — aggregating dozens of access closets with routed uplinks toward the core, summarizing routes outward, and terminating user gateways with HSRP pairs.
- Any inter-VLAN routing scenario where a router-on-a-stick design has become the bottleneck — one trunk into one router interface caps the entire inter-VLAN aggregate at that single link.
Reach for a router instead when the requirement is a WAN or Internet termination, large-scale NAT/PAT, full BGP Internet tables, per-tunnel encryption at scale, or advanced QoS shaping on slow circuits. In practice every campus needs both: Layer 3 switches for the interior, routers (or SD-WAN appliances) at the edge. If the estate has accumulated a mix of both with unclear roles, that is an architecture conversation — WUC professional services runs exactly that assessment.
Planning a Catalyst deployment or refresh? Tell our engineers what is in your estate — model selection, licensing, and post-SMARTnet options scoped in writing, without leaving this page.
Reference topology: three VLANs behind one Layer 3 switch
Every configuration step in this guide maps onto the topology below: three VLANs — users, servers, and voice — terminating on a Catalyst Layer 3 switch, with a routed uplink to the Internet edge router.
Reference topology · inter-VLAN routing with an upstream router
Packet flow, concretely: a workstation at 10.10.10.50 opens a session to a server at 10.10.20.80. The workstation compares destination to its own subnet, sees a mismatch, and forwards the frame to its default gateway — the SVI at 10.10.10.1. The switch strips the VLAN 10 encapsulation, performs a hardware route lookup, finds 10.10.20.0/24 directly connected on SVI 20, rewrites the destination MAC to the server (resolving via ARP if needed), and forwards out the server port tagged VLAN 20. Round trip, the path never leaves the switch. Only flows with no more-specific route — Internet traffic — follow the default route up the /30 to the edge router. Keep this picture in mind during configuration: every vlan, interface Vlan, and ip route command below builds one piece of it.
Which Catalyst model are you actually deploying?
Cisco’s enterprise L3 switch lineup splits into four roles. Picking the right model is the first decision and the one that’s hardest to undo.
| Model family | Role | Typical use | L3 throughput | Stacking | Common license tier |
|---|---|---|---|---|---|
| Catalyst 9200 / 9200L | Access with limited L3 | Branch, small campus access | Up to 80 Gbps | StackWise-160 / 80 (8 units) | Network Essentials |
| Catalyst 9300 / 9300X | Stackable access / small distribution | Most common enterprise L3 access | 400-1000 Gbps | StackWise-480 / 1T (8 units) | Essentials or Advantage |
| Catalyst 9400 | Modular chassis | Aggregation, dense access | Up to 9 Tbps | Chassis (redundant supervisors) | Advantage |
| Catalyst 9500 | Fixed core / aggregation | Distribution / core | Up to 4 Tbps | StackWise Virtual (2 units) | Advantage |
| Catalyst 9600 | Modular core | Campus core / very large distribution | Up to 25.6 Tbps | Chassis / StackWise Virtual | Advantage |
| Nexus 9300 / 9500 | Data center fabric | DC top-of-rack, spine-leaf | NX-OS — different procedure | vPC (not StackWise) | NX-OS licensing |
A typical three-tier campus uses the 9200 at access, 9300 at distribution, and 9500 at the core (Figure 01).
Figure 01 · Three-tier campus topology
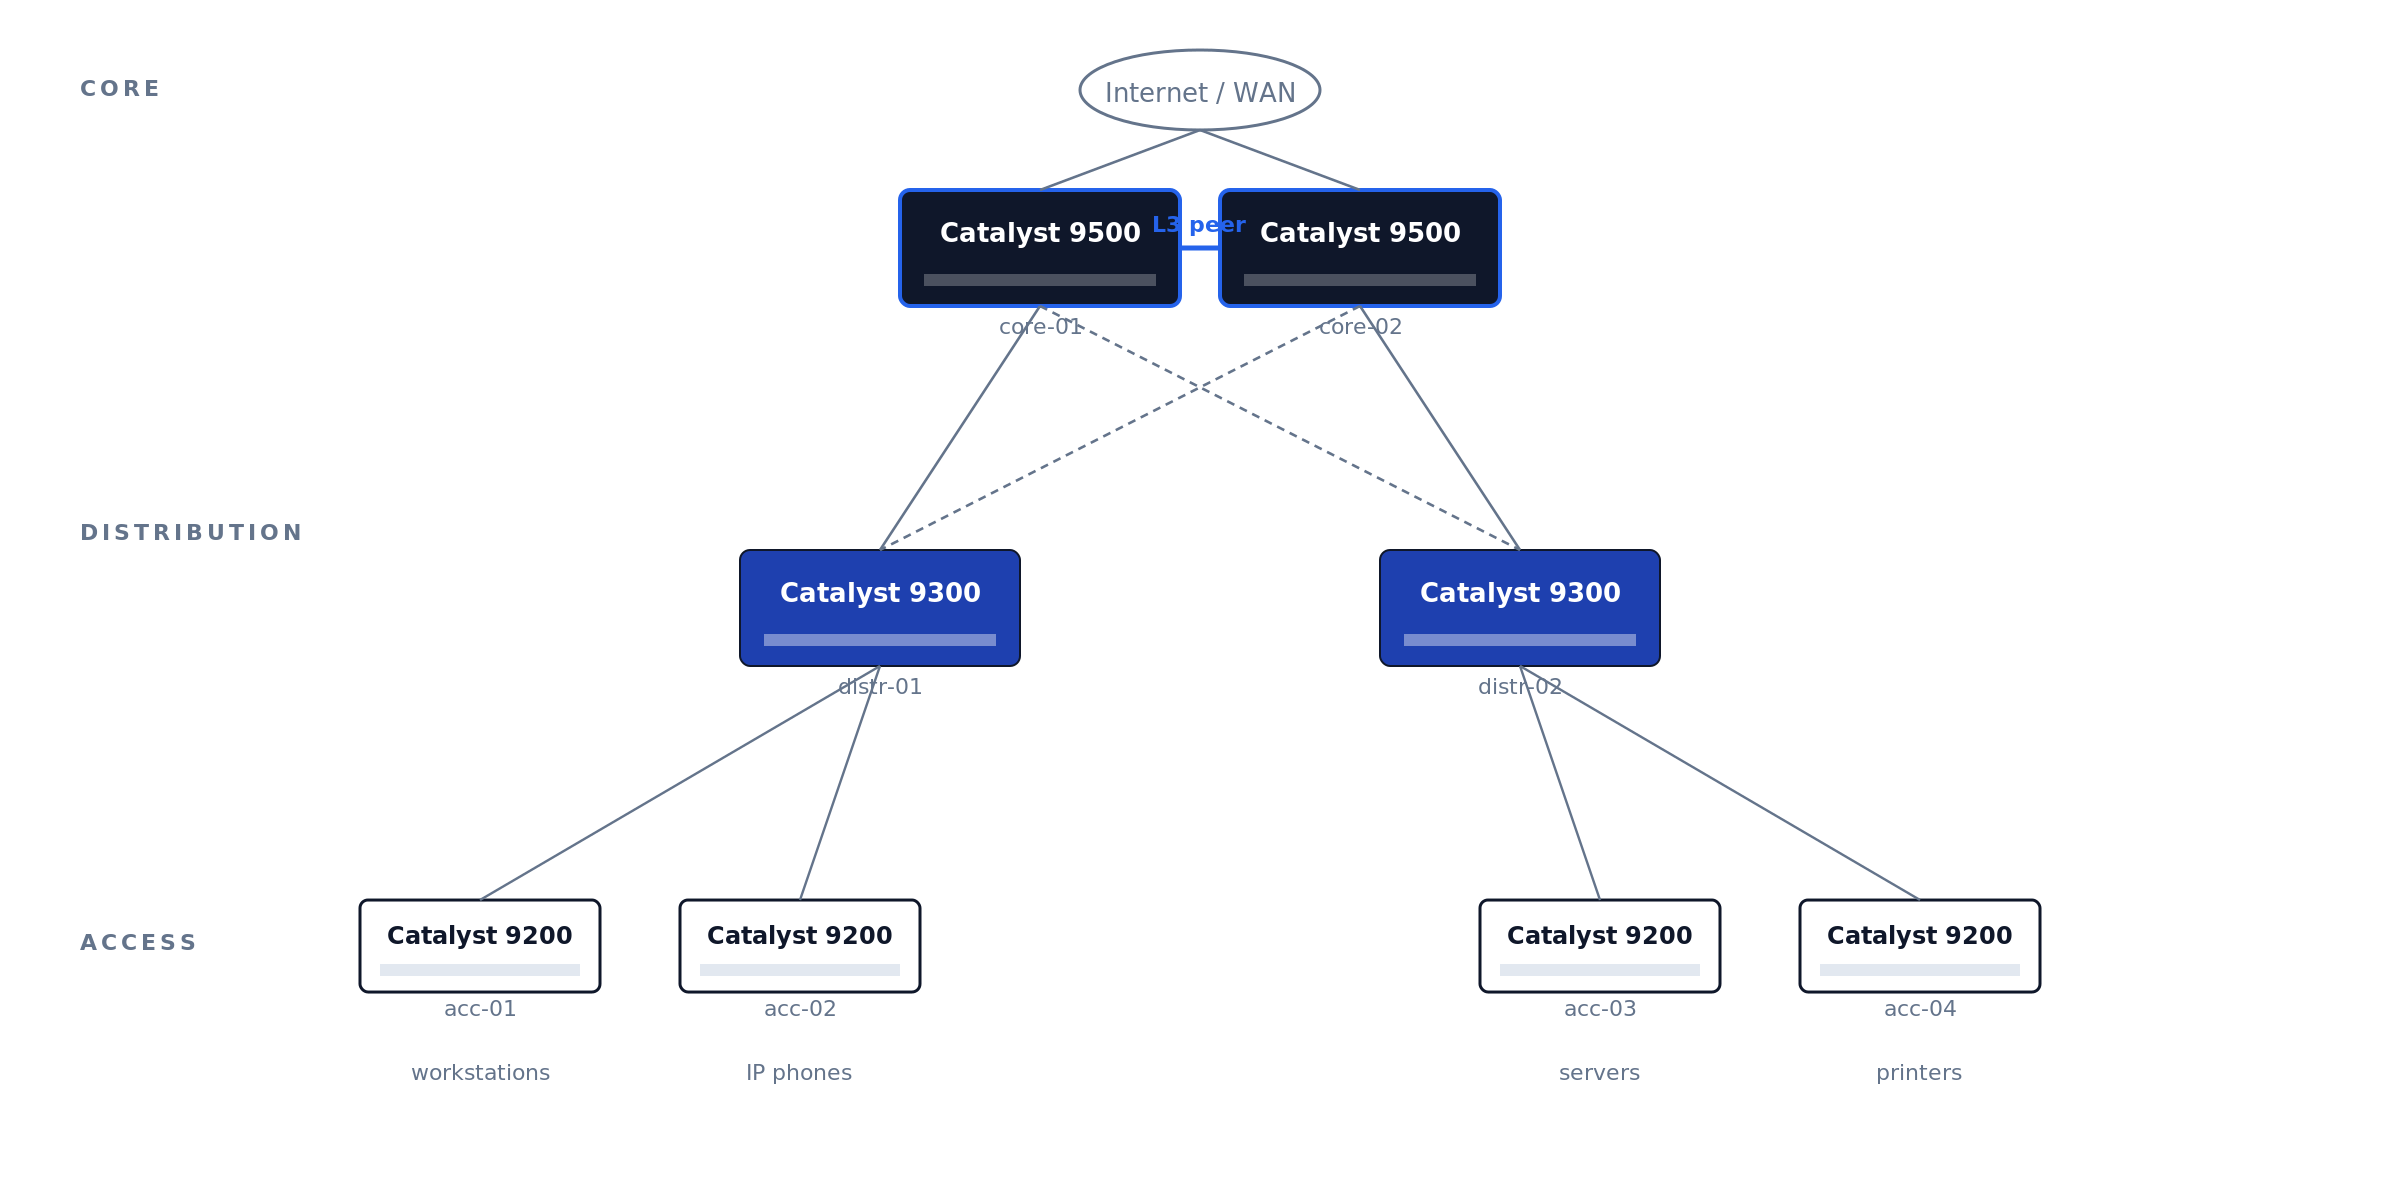
Legacy 3850, 3650, and 4500-X are still in production but hit End-of-Software-Support in 2025-2026 — new deployments should default to C9000.
The Catalyst estates we take over for maintenance rarely fail on hardware — they fail on records. The recurring pattern: mixed 3850-and-9300 closets mid-migration with no cutover plan, stack rings cabled but never verified (one member silently running a different IOS-XE train), and license tiers that do not match what the config actually uses — discovered only when the renewal quote arrives. An hour spent on Phase 0 decisions and documentation saves a forensic week at refresh time.
Before unboxing — decisions to lock down
Five questions, all answered on paper before the switch leaves the box:
1. What’s the role and physical location? Top-of-rack? Distribution? Campus core? The role determines uplink architecture (LACP to two upstream cores? StackWise Virtual pair?) and whether you need to peer with anything via OSPF/BGP.
2. What’s the management plan? Out-of-band management network is the right answer for any production Catalyst. The C9300 has a dedicated GigabitEthernet0/0 management port physically isolated from the data-plane ports — use it. In-band management on the SVI works but loses you access the moment you fat-finger an ACL.
3. What’s the IP plan? Management IP, every SVI subnet, every routed port, every BGP/OSPF peer. Document in NetBox, phpIPAM, or whatever your IPAM of record is. Spreadsheets get stale.
4. What software version? Cisco publishes a Suggested Release per platform on the release-tracking page. As of the November 2025 update to that page, Cisco lists IOS-XE 17.12.6 and 17.15.4 as the recommended C9300 releases — prefer the Extended-Maintenance trains (17.12.x and 17.15.x) over Standard-Support releases, and migrate off 17.3.x, which has an announced end-of-life.
5. Are you using Cisco DNA Center / Catalyst Center? If yes, the switch can self-onboard via Plug and Play. If no, you’ll be doing this by hand — and you’ll want to disable PnP before the first boot.
Physical setup and first power-on
Rack, ground (rack ground bonding to the chassis ground lug, not just the chassis screw), cable: dual PSUs to dual circuits, console cable to your laptop, uplinks unplugged for now. Console settings: 9600 8N1, no flow control. The C9300X and newer C9500 ship with both RJ-45 serial and USB-C console — same settings, different device path.
The C9300 boot sequence: ROMMON loader (~10s) → IOS-XE bootloader (~30s) → Linux kernel and IOSd (~90s) → “Press RETURN to get started” — but if PnP is enabled (the default), it will attempt DHCP and DNS-based PnP discovery for 5-10 minutes before giving up. Press RETURN to skip.
Factory-reset a refurb/return-from-stock unit before anything else:
Switch# write erase
Switch# delete /force flash:vlan.dat
Switch# factory-reset all secure 1-pass
Switch# reload
Disable PnP if you’re not using Catalyst Center
First command on a non-DNA-managed switch. Skip it and every reboot hangs 10 min on PnP discovery.
Disable the zero-touch profile and the startup-VLAN trigger
Switch# configure terminal
Switch(config)# pnp profile pnp-zero-touch
Switch(config-pnp-init)# no transport http
Switch(config-pnp-init)# exit
Switch(config)# no pnp startup-vlan
Switch(config)# end
Switch# write memory
On newer code (IOS-XE 17.6+): pnpa service discovery stop from privileged-exec mode achieves the same in one command.
Set hostname, time, admin user
Hostname, NTP, domain
Switch(config)# hostname dc1-distr-c9300-01
dc1-distr-c9300-01(config)# clock timezone EST -5 0
dc1-distr-c9300-01(config)# ntp server 10.0.0.10 prefer
dc1-distr-c9300-01(config)# ntp server 10.0.0.11
dc1-distr-c9300-01(config)# ntp source GigabitEthernet0/0
dc1-distr-c9300-01(config)# ip domain name corp.example.com
Strong admin user, disable defaults
dc1-distr-c9300-01(config)# username netadmin privilege 15 algorithm-type scrypt secret <STRONG_PASSWORD>
dc1-distr-c9300-01(config)# no username admin
dc1-distr-c9300-01(config)# no username cisco
dc1-distr-c9300-01(config)# enable algorithm-type scrypt secret <STRONG_ENABLE_PASSWORD>
dc1-distr-c9300-01(config)# service password-encryption
Scrypt (secret 9) is the strongest password hash IOS-XE supports. Default admin and cisco accounts ship enabled on some refurb units — always disable.
Smart Licensing — the step that breaks most fresh deployments
IOS-XE 16.10+ requires Smart Licensing. IOS-XE 17.3.2+ uses Smart Licensing Using Policy (SLUP). Both grant a 90-day eval period. After 90 days without registration: feature throttling, persistent CLI warnings, logged enforcement events that auditors will ask about.
Register during initial deployment, not after the 90-day timer expires. Re-registration after enforcement triggers requires Cisco TAC intervention on some platforms. The CSSM token install is a 30-second step; the recovery if you miss the window is hours.
Unregistered Smart Licensing is the single most common finding when we baseline an inherited Catalyst estate. The switch works fine for 90 days, the project team moves on, and the eval timer expires in production — usually noticed when an auditor asks about the enforcement events in the logs, or when a TAC case for an unrelated issue stalls on entitlement. Registration is a 30-second step during deployment and an hours-long recovery after enforcement.
Three deployment paths: direct CSSM (internet-connected), on-prem SSM (your local appliance syncs to Cisco), or air-gapped reservation (SLR/PLR — manual code exchange).
dc1-distr-c9300-01(config)# license smart transport smart
dc1-distr-c9300-01(config)# license smart url default
dc1-distr-c9300-01# license smart trust idtoken <TOKEN_FROM_CSSM> all
Verify with show license summary, show license status, show license usage. Status should read REGISTERED and AUTHORIZED — not EVAL.
Configure management VLAN and SSH
Use the dedicated management interface (GigabitEthernet0/0) for OOB. It’s in a separate VRF (Mgmt-vrf) by default and isolated from the data plane.
dc1-distr-c9300-01(config)# interface GigabitEthernet0/0
dc1-distr-c9300-01(config-if)# description OOB-MGMT
dc1-distr-c9300-01(config-if)# vrf forwarding Mgmt-vrf
dc1-distr-c9300-01(config-if)# ip address 10.99.99.10 255.255.255.0
dc1-distr-c9300-01(config-if)# no shutdown
dc1-distr-c9300-01(config)# ip route vrf Mgmt-vrf 0.0.0.0 0.0.0.0 10.99.99.1
dc1-distr-c9300-01(config)# ip ssh version 2
dc1-distr-c9300-01(config)# crypto key generate rsa modulus 2048 label SSH-KEY
dc1-distr-c9300-01(config)# line vty 0 15
dc1-distr-c9300-01(config-line)# transport input ssh
dc1-distr-c9300-01(config-line)# login local
dc1-distr-c9300-01(config-line)# access-class MGMT-ACL in vrf-also
dc1-distr-c9300-01(config)# ip access-list standard MGMT-ACL
dc1-distr-c9300-01(config-std-nacl)# permit 10.0.0.0 0.255.255.255
dc1-distr-c9300-01(config-std-nacl)# deny any log
vrf forwarding Mgmt-vrf isolates management traffic from the data plane. crypto key generate rsa with explicit label is required or SSH fails silently. access-class ... vrf-also matches both default and management VRF; without vrf-also, Mgmt-vrf bypasses the ACL entirely.
Configure Layer 3 routing
Enable IP routing globally:
dc1-distr-c9300-01(config)# ip routing
dc1-distr-c9300-01(config)# ipv6 unicast-routing
Create VLANs and their SVIs. The SVI is a virtual L3 interface bound to a VLAN — its IP becomes the gateway for hosts in that VLAN (Figure 02 shows the routing flow).
dc1-distr-c9300-01(config)# vlan 10
dc1-distr-c9300-01(config-vlan)# name USERS
dc1-distr-c9300-01(config)# interface Vlan10
dc1-distr-c9300-01(config-if)# ip address 10.10.10.1 255.255.255.0
dc1-distr-c9300-01(config-if)# ip helper-address 10.0.0.50
dc1-distr-c9300-01(config-if)# no shutdown
Figure 02 · SVI inter-VLAN routing flow
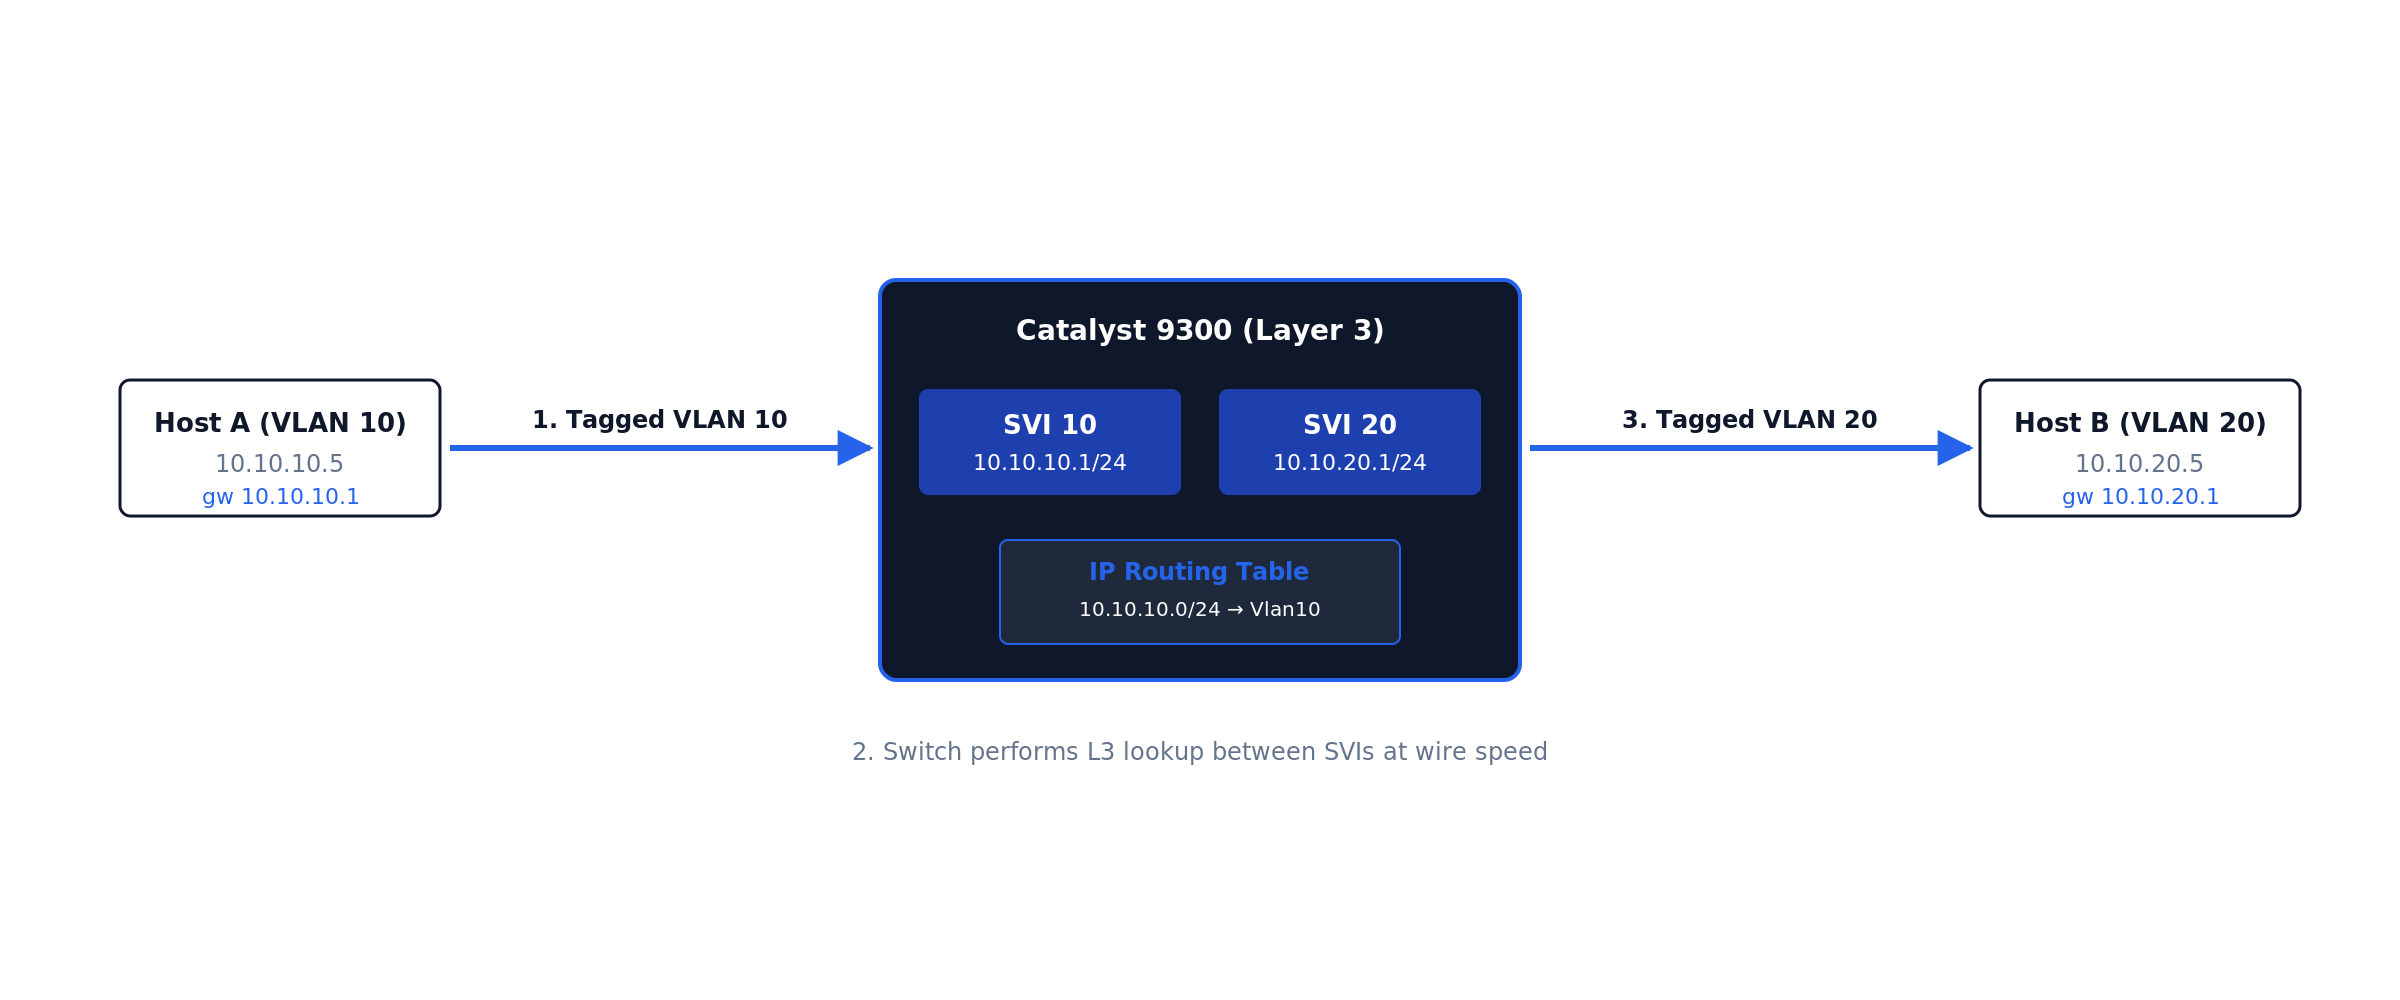
Internally, the switch performs five decision stages in hardware ASIC at wire speed (Figure 03):
Figure 03 · VLAN → SVI → routing-table data path
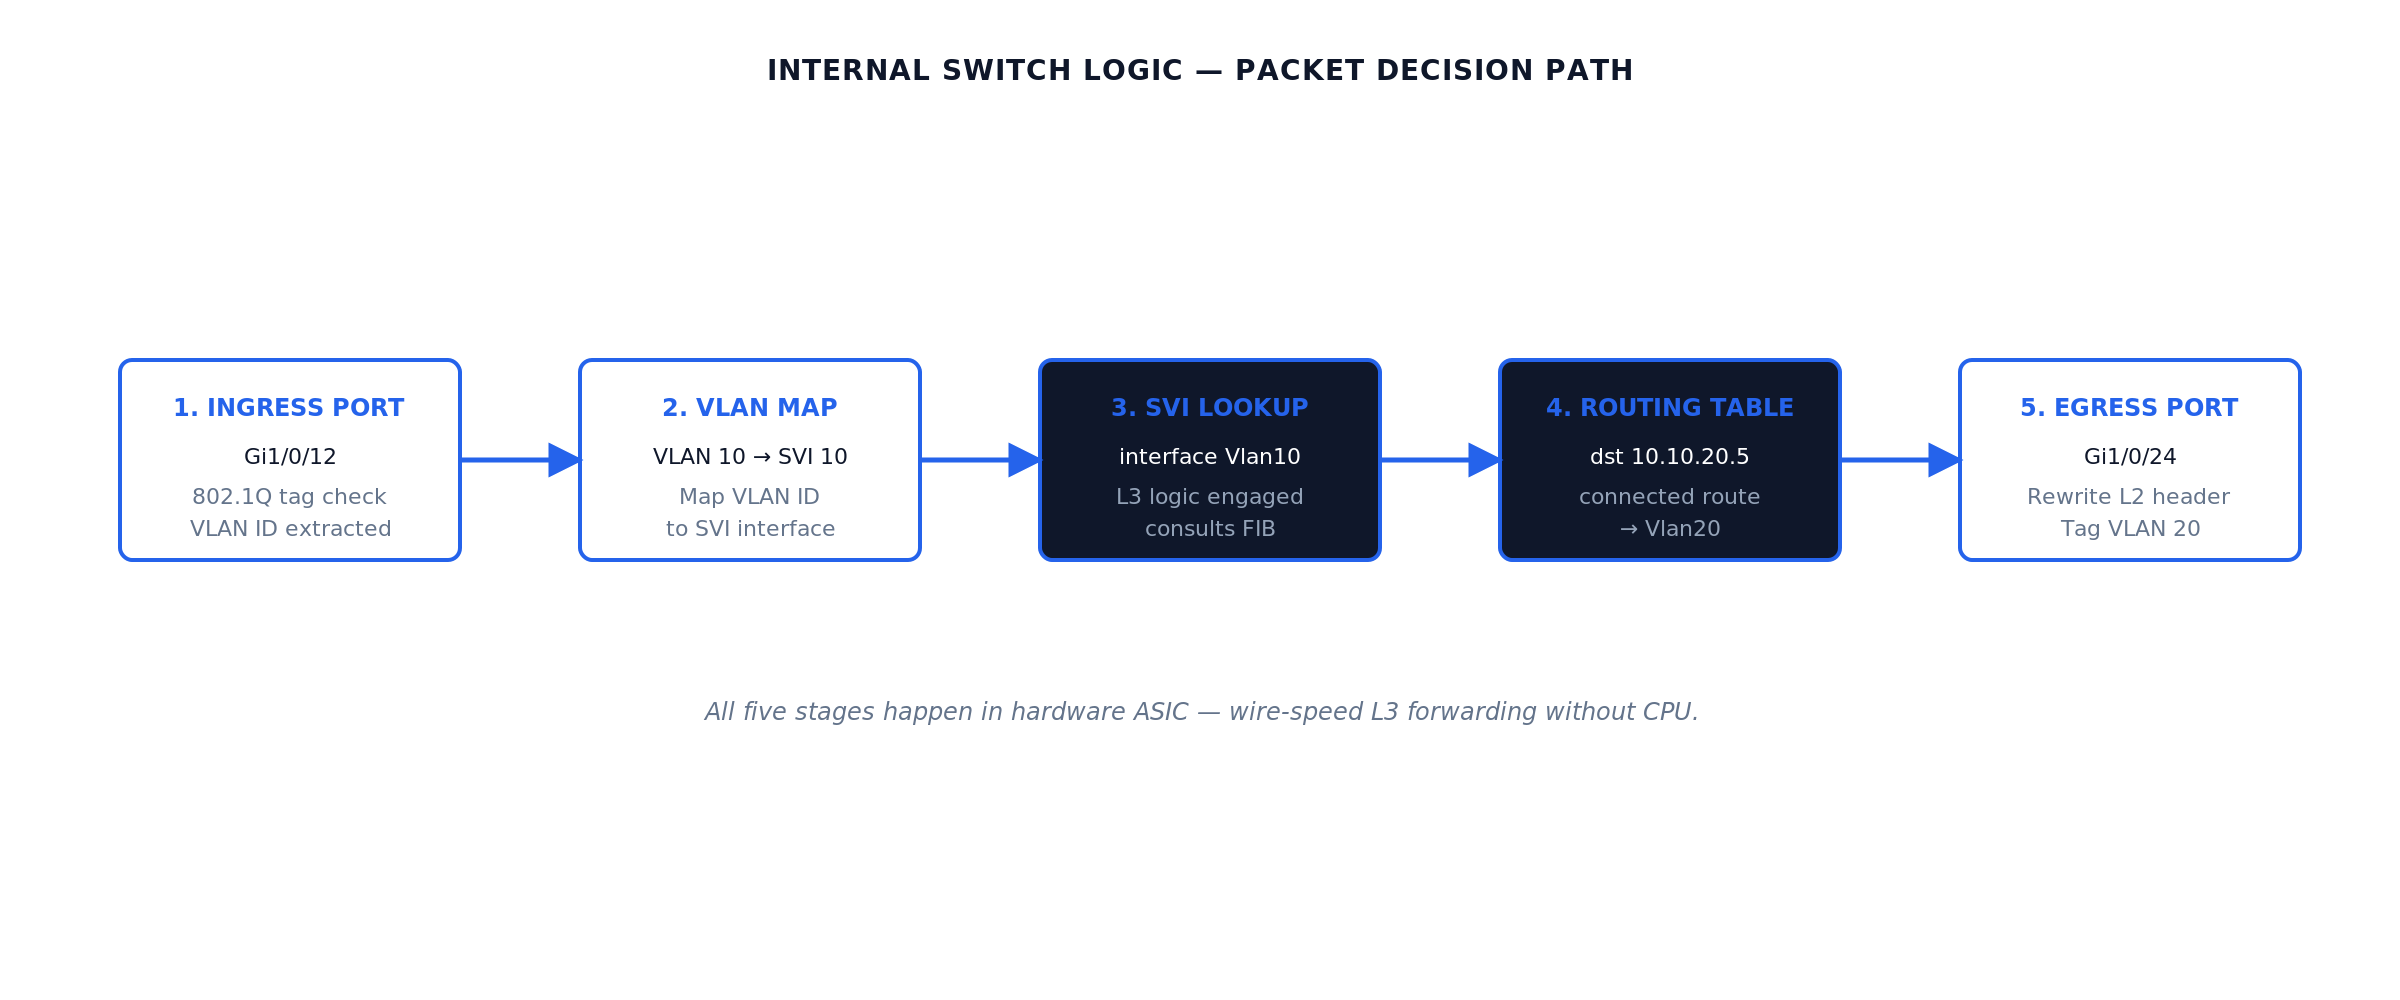
RFC 1812 defines the host-routing behavior the SVI implements. The L3 switch is a high-speed hardware router with embedded L2 ports.
ip helper-address forwards DHCP broadcasts to your DHCP server — without it, users in the VLAN never receive a DHCP lease. The relay rewrites the broadcast as a unicast packet routed to the configured helper IP (Figure 07 shows the flow).
Repeat for the remaining VLANs in the reference topology. Expected behavior after each no shutdown: the SVI shows up/up in show ip interface brief only once the VLAN exists and at least one physical port in that VLAN is up — an SVI with no live ports stays down by design (autostate). This surprises engineers staging switches on the bench with nothing plugged in.
dc1-distr-c9300-01(config)# vlan 20
dc1-distr-c9300-01(config-vlan)# name SERVERS
dc1-distr-c9300-01(config)# vlan 30
dc1-distr-c9300-01(config-vlan)# name VOICE
dc1-distr-c9300-01(config)# interface Vlan20
dc1-distr-c9300-01(config-if)# ip address 10.10.20.1 255.255.255.0
dc1-distr-c9300-01(config-if)# no shutdown
dc1-distr-c9300-01(config)# interface Vlan30
dc1-distr-c9300-01(config-if)# ip address 10.10.30.1 255.255.255.0
dc1-distr-c9300-01(config-if)# ip helper-address 10.10.20.50
dc1-distr-c9300-01(config-if)# no shutdown
Access ports carrying a phone and a PC use the voice-VLAN construct — one physical port, two VLANs, no trunk configuration on the host side:
dc1-distr-c9300-01(config)# interface GigabitEthernet1/0/12
dc1-distr-c9300-01(config-if)# switchport mode access
dc1-distr-c9300-01(config-if)# switchport access vlan 10
dc1-distr-c9300-01(config-if)# switchport voice vlan 30
dc1-distr-c9300-01(config-if)# spanning-tree portfast
Default route — the step that connects everything else to the world. In the reference topology the switch knows VLANs 10/20/30 because they are directly connected; it knows nothing about the Internet. A small site that does not justify a routing protocol uses one static default toward the edge router, and the edge router needs return routes for the user subnets (or a summary):
dc1-distr-c9300-01(config)# ip route 0.0.0.0 0.0.0.0 10.255.0.1

! verify:
dc1-distr-c9300-01# show ip route static
S*    0.0.0.0/0 [1/0] via 10.255.0.1
Why this matters: the single most common “inter-VLAN routing works but Internet does not” ticket is a missing or wrong default route — covered with the other failure modes in the troubleshooting section. Larger campuses skip the static and learn the default via OSPF from the core, which is the next step.
Choose a routing protocol. OSPF is the most common for new Cisco campus deployments:
dc1-distr-c9300-01(config)# router ospf 1
dc1-distr-c9300-01(config-router)# router-id 10.99.99.10
dc1-distr-c9300-01(config-router)# passive-interface default
dc1-distr-c9300-01(config-router)# no passive-interface TenGigabitEthernet1/1/1
dc1-distr-c9300-01(config-router)# no passive-interface TenGigabitEthernet1/1/2
dc1-distr-c9300-01(config-router)# network 10.0.0.0 0.255.255.255 area 0
dc1-distr-c9300-01(config-router)# auto-cost reference-bandwidth 100000
dc1-distr-c9300-01(config-router)# bfd all-interfaces
Default OSPF hello/dead intervals give 40-second failover. Bidirectional Forwarding Detection (BFD) drops detection to sub-second by sending lightweight 50ms hello packets. Production campus cores should always enable BFD on OSPF interfaces.
OSPF area design on a 9500 core
A two-9500 core typically runs all routers in OSPF area 0 (the backbone area), with the distribution switches as additional area 0 members. For larger campuses, distribution switches can run their own areas with the cores as ABRs — but that’s only worth the complexity above ~20 routers per area. Figure 04 shows the simple two-core layout.
Figure 04 · OSPF area 0 design — two cores, four distribution switches
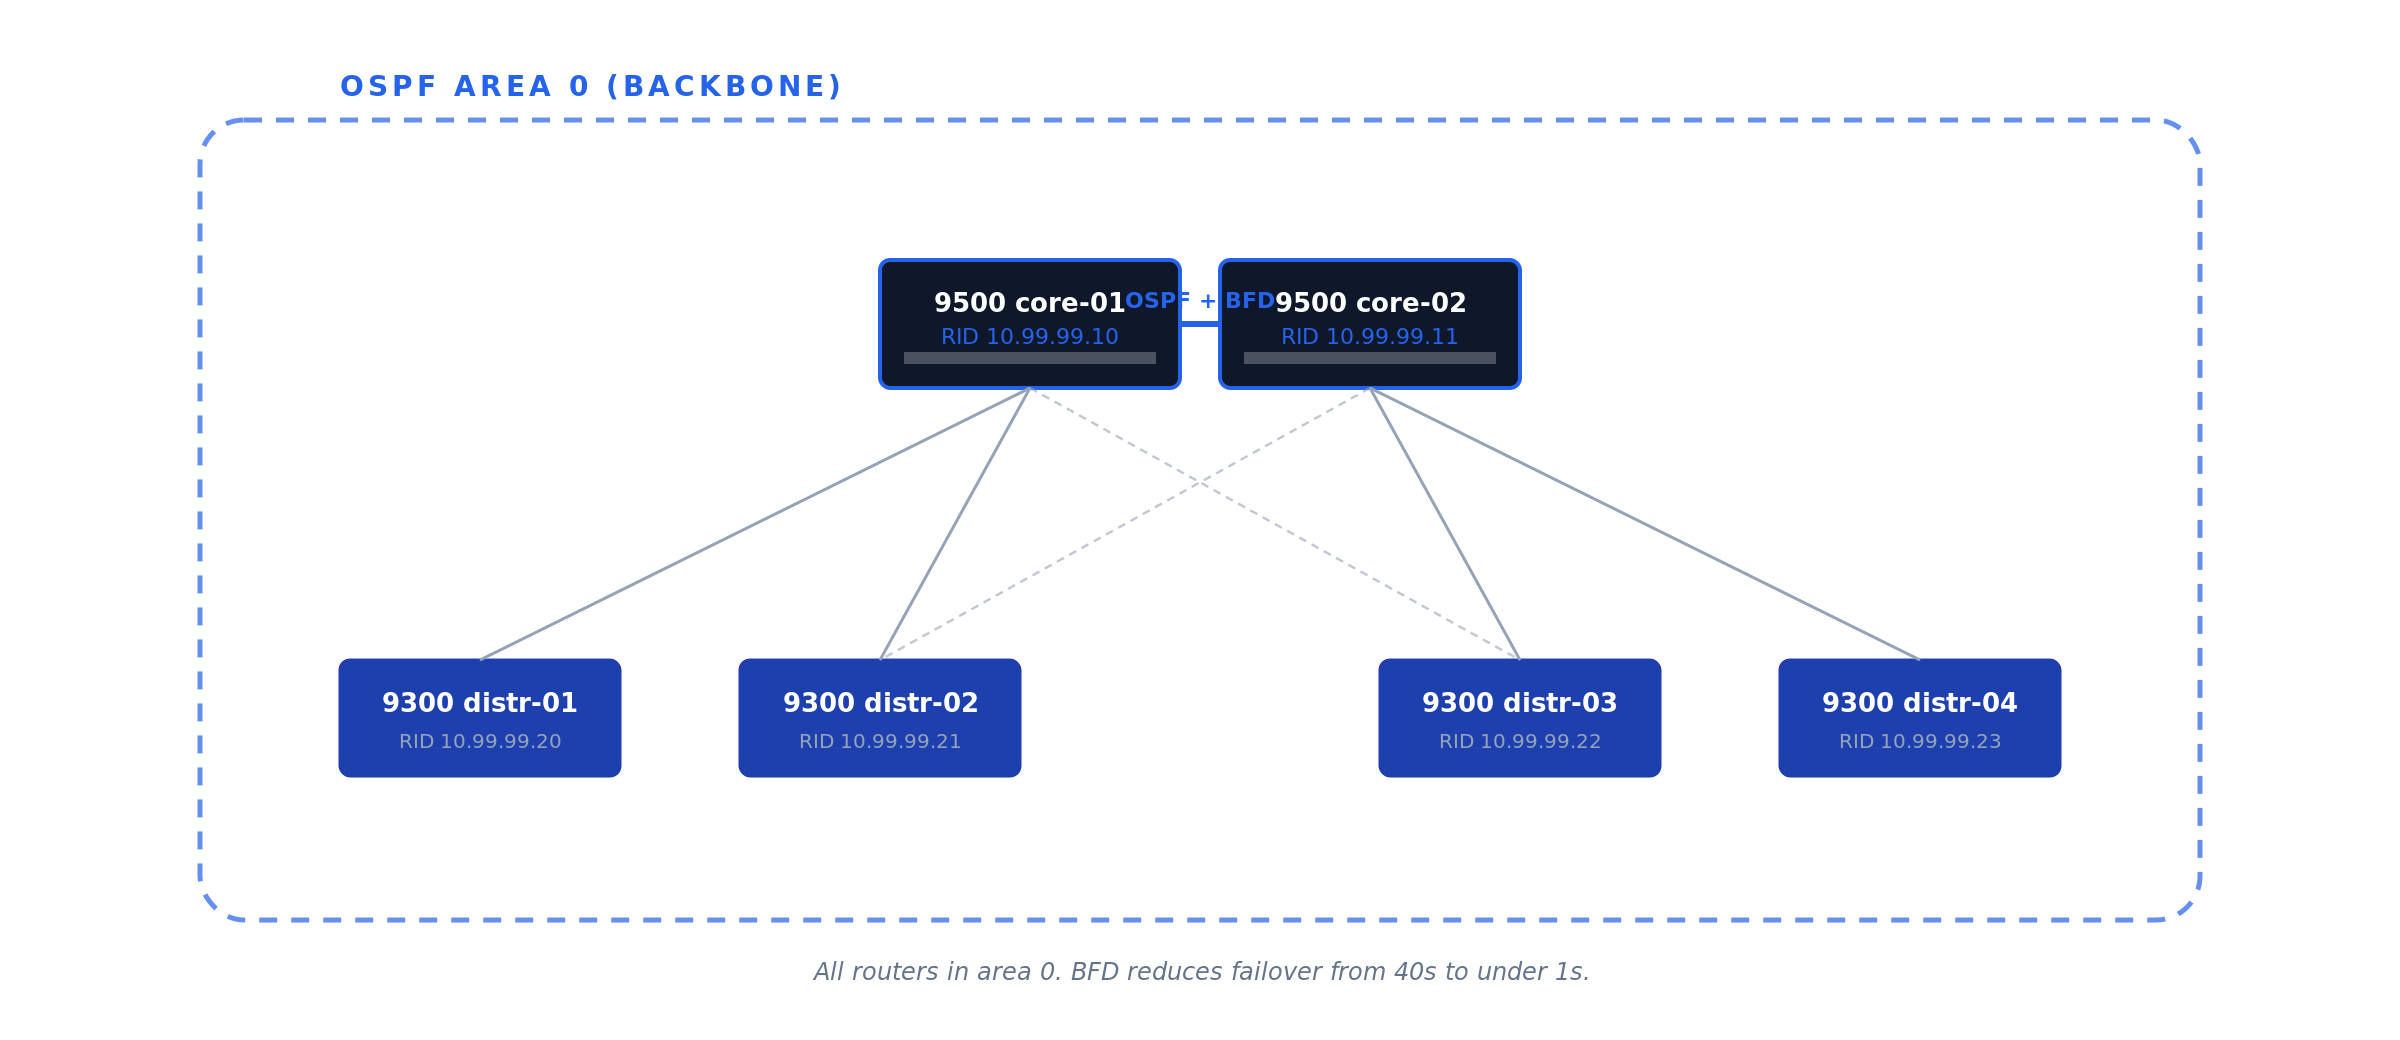
Gateway redundancy with HSRP
A single L3 switch as the default gateway for hundreds of users is a single point of failure. Hot Standby Router Protocol (HSRP, Cisco proprietary) and Virtual Router Redundancy Protocol (VRRP, RFC 5798) both solve this by presenting a virtual IP that two physical switches share (Figure 05).
Use HSRP for all-Cisco environments (simpler config, slightly faster HSRPv2 convergence). Use VRRP for mixed-vendor (standards-based). Functionally equivalent for the common case.
# core-01 (active)
dc1-core-c9500-01(config-if)# standby version 2
dc1-core-c9500-01(config-if)# standby 10 ip 10.10.10.1
dc1-core-c9500-01(config-if)# standby 10 priority 110
dc1-core-c9500-01(config-if)# standby 10 preempt
dc1-core-c9500-01(config-if)# standby 10 authentication md5 key-string <HSRP_KEY>

# core-02 (standby)
dc1-core-c9500-02(config-if)# standby version 2
dc1-core-c9500-02(config-if)# standby 10 ip 10.10.10.1
dc1-core-c9500-02(config-if)# standby 10 priority 100
dc1-core-c9500-02(config-if)# standby 10 preempt
Figure 05 · HSRP gateway redundancy
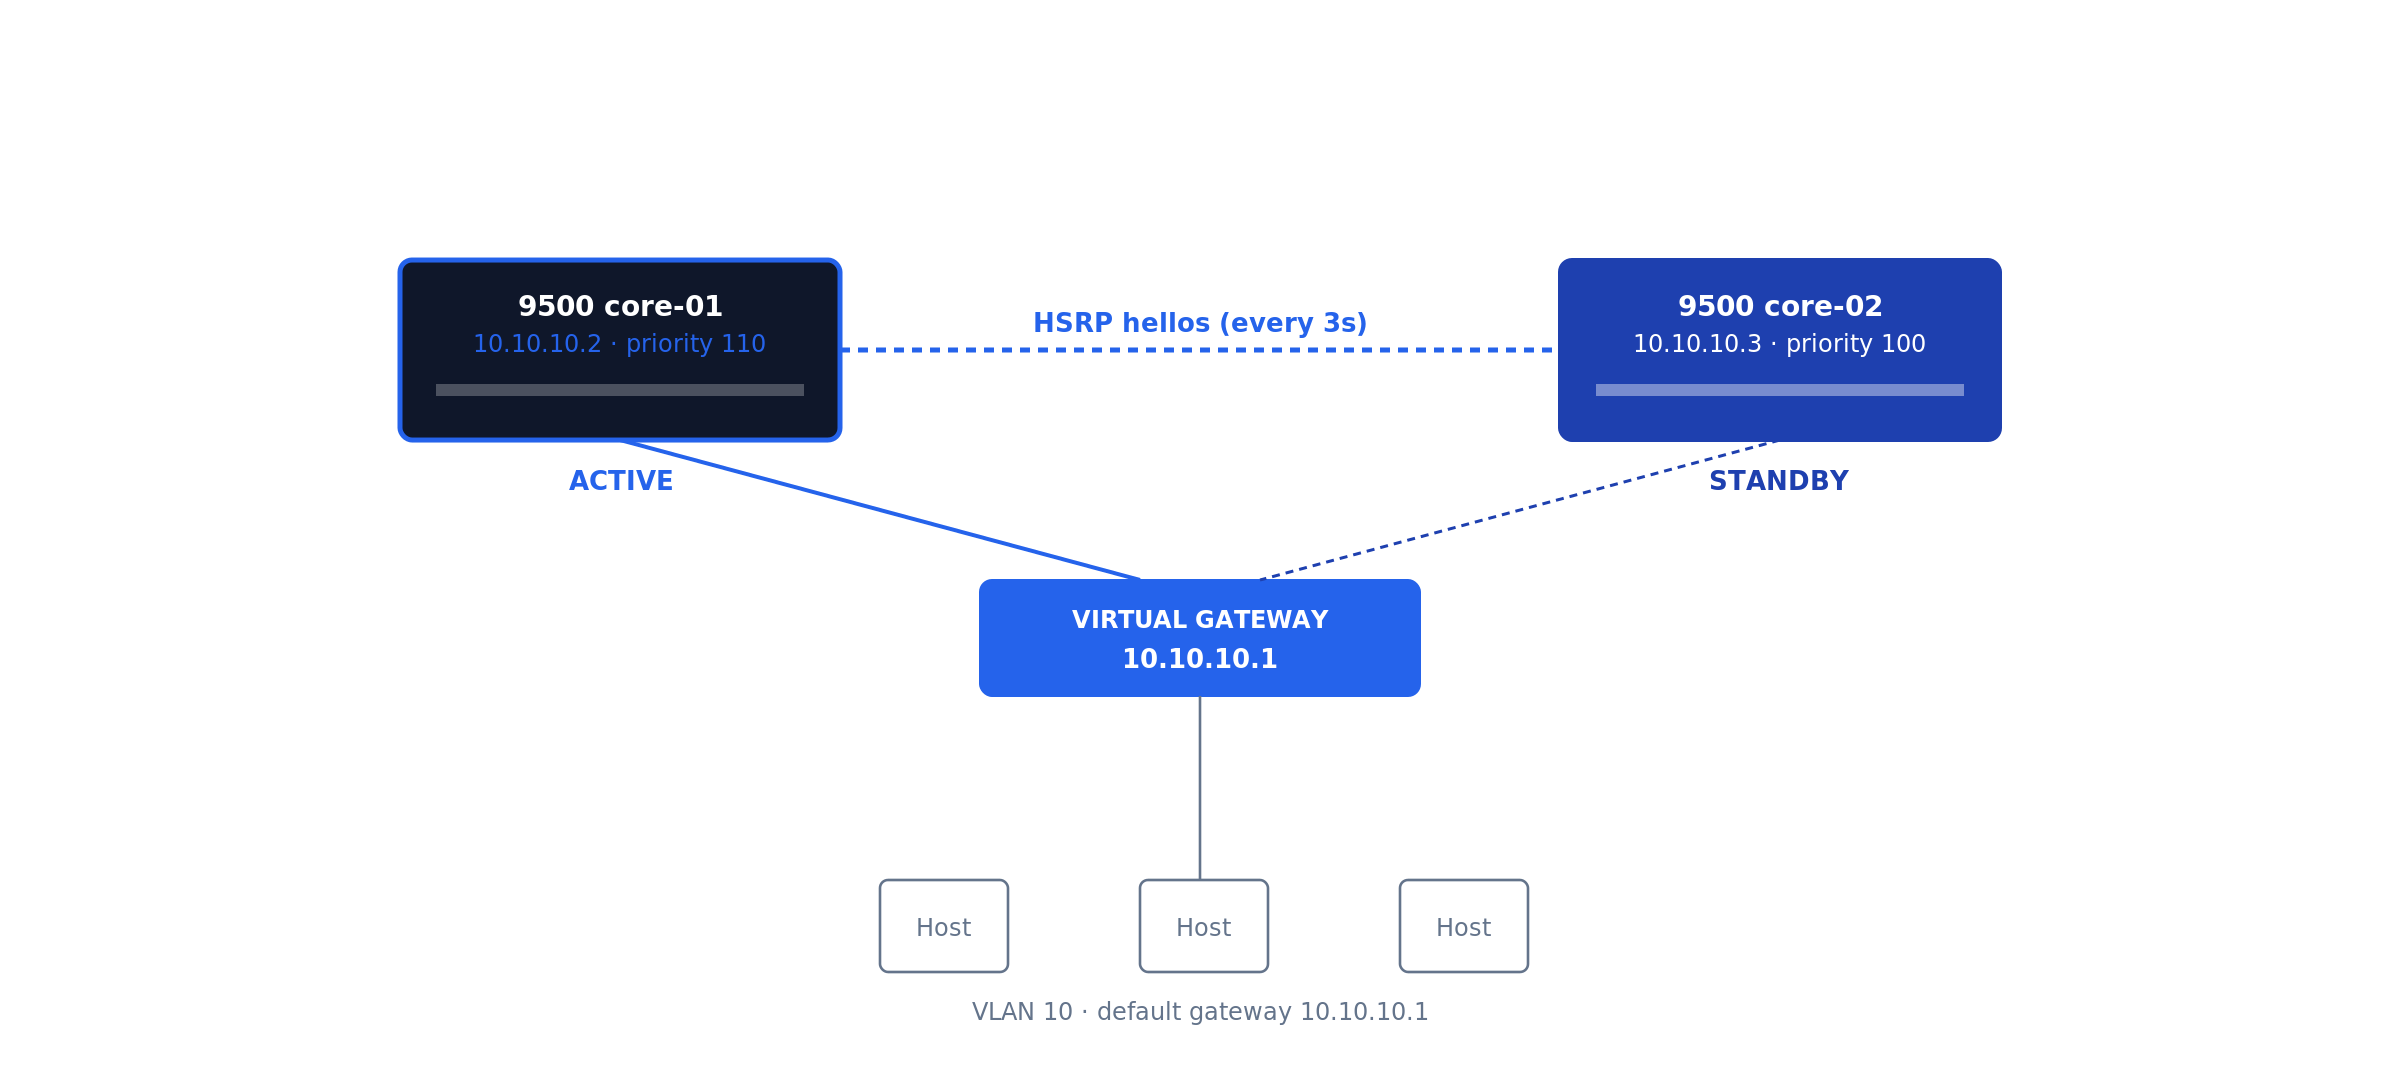
Hosts in VLAN 10 set their default gateway to 10.10.10.1 (the virtual IP). preempt ensures the higher-priority router takes ownership back when it returns.
Cisco-specific hardening & LACP uplinks
The Catalyst defaults are tuned for “deploy fast in a lab” — production needs more. Apply the Cisco IOS-XE Hardening Guide in full; this section is the highest-impact subset, mapped to NIST SP 800-53 Rev 5 control families AC-3, AC-17, AU-2, SC-7, SC-8.
Disable services running by default
dc1-distr-c9300-01(config)# no ip http server
dc1-distr-c9300-01(config)# no ip http secure-server
dc1-distr-c9300-01(config)# no service pad
dc1-distr-c9300-01(config)# no service finger
dc1-distr-c9300-01(config)# no service tcp-small-servers
dc1-distr-c9300-01(config)# no service udp-small-servers
LACP port-channel uplinks
Inter-switch uplinks should always use LACP for both throughput and resilience (Figure 06).
Figure 06 · LACP port-channel uplink

dc1-distr-c9300-01(config)# interface range TenGigabitEthernet1/1/1 - 2
dc1-distr-c9300-01(config-if-range)# channel-group 1 mode active
dc1-distr-c9300-01(config)# interface Port-channel1
dc1-distr-c9300-01(config-if)# switchport mode trunk
dc1-distr-c9300-01(config-if)# switchport trunk allowed vlan 10,20,99
DHCP snooping and Dynamic ARP Inspection
These prevent rogue DHCP servers and ARP-spoofing attacks. Trust only the uplinks. Figure 07 shows the DHCP relay packet flow.
Figure 07 · DHCP relay (ip helper-address) flow
ip helper-address. The SVI catches the client’s broadcast DISCOVER, rewrites it as a unicast packet to the configured helper address, and routes it to the DHCP server in a different VLAN. · Click diagram to enlarge.dc1-distr-c9300-01(config)# ip dhcp snooping dc1-distr-c9300-01(config)# ip dhcp snooping vlan 10,20 dc1-distr-c9300-01(config)# ip arp inspection vlan 10,20 dc1-distr-c9300-01(config)# interface Port-channel1 dc1-distr-c9300-01(config-if)# ip dhcp snooping trust dc1-distr-c9300-01(config-if)# ip arp inspection trust
SNMPv3, TACACS+, remote syslog
Never SNMPv2c in production (cleartext community). Centralize auth via TACACS+ with local fallback. Ship logs to remote syslog from day one — the logs that matter during an incident are the ones from before the incident.
Stack configuration (Catalyst 9300)
The C9300 stacks up to 8 units via StackWise-480 (480 Gbps backplane). The newer C9300X family upgrades to StackWise-1T (1 Tbps). Either way, the stack appears as a single logical switch with a single management IP and config (Figure 08).
Figure 08 · StackWise ring topology
Do not mix IOS-XE versions across stack members. A stack with mismatched versions enters version-mismatch mode and one or more members drop offline until versions converge via auto-upgrade. Always pre-stage matching versions or schedule a maintenance window long enough to absorb the auto-upgrade reload.
How to verify Layer 3 routing is working
The Cisco-specific verification commands you actually need:
dc1-distr-c9300-01# show version
dc1-distr-c9300-01# show inventory
dc1-distr-c9300-01# show interfaces status
dc1-distr-c9300-01# show ip route
dc1-distr-c9300-01# show ip ospf neighbor
dc1-distr-c9300-01# show etherchannel summary
dc1-distr-c9300-01# show standby brief
dc1-distr-c9300-01# show ip dhcp snooping
dc1-distr-c9300-01# show license summary
dc1-distr-c9300-01# show switch
dc1-distr-c9300-01# write memory
The dump above is the full checklist. The six commands below are the ones that prove Layer 3 routing is actually working — what each validates, what healthy output looks like on the reference topology, and what to read from it.
show ip route — is the routing table built?
dc1-distr-c9300-01# show ip route
Gateway of last resort is 10.255.0.1 to network 0.0.0.0

S*    0.0.0.0/0 [1/0] via 10.255.0.1
      10.0.0.0/8 is variably subnetted, 8 subnets, 2 masks
C        10.10.10.0/24 is directly connected, Vlan10
L        10.10.10.1/32 is directly connected, Vlan10
C        10.10.20.0/24 is directly connected, Vlan20
L        10.10.20.1/32 is directly connected, Vlan20
C        10.10.30.0/24 is directly connected, Vlan30
L        10.10.30.1/32 is directly connected, Vlan30
C        10.255.0.0/30 is directly connected, TenGigabitEthernet1/1/1
L        10.255.0.2/32 is directly connected, TenGigabitEthernet1/1/1
Validates the heart of the system. Each healthy SVI produces a C (connected network) and L (local address) pair — a VLAN subnet missing here means its SVI is down, and no amount of host-side fiddling will fix that. Gateway of last resort must be set; if it reads not set, Internet-bound traffic dies at this switch. In an OSPF design you also expect O routes from neighbors — their absence means adjacencies are down.
show ip interface brief — are the L3 interfaces up?
dc1-distr-c9300-01# show ip interface brief | exclude unassigned
Interface              IP-Address      OK? Method Status                Protocol
Vlan10                 10.10.10.1      YES NVRAM  up                    up
Vlan20                 10.10.20.1      YES NVRAM  up                    up
Vlan30                 10.10.30.1      YES NVRAM  up                    up
GigabitEthernet0/0     10.99.99.10     YES NVRAM  up                    up
TenGigabitEthernet1/1/1 10.255.0.2     YES NVRAM  up                    up
The fastest triage view. up/up is the only acceptable state for a production SVI. administratively down means a missing no shutdown; down/down on an SVI means autostate has no live port in that VLAN — both are diagnosed in the troubleshooting section.
show vlan brief — do the VLANs exist and own the right ports?
dc1-distr-c9300-01# show vlan brief
VLAN Name                             Status    Ports
---- -------------------------------- --------- -------------------------------
1    default                          active    Gi1/0/45, Gi1/0/46
10   USERS                            active    Gi1/0/1, Gi1/0/2, Gi1/0/12
20   SERVERS                          active    Gi1/0/24, Gi1/0/25
30   VOICE                            active    Gi1/0/12
99   MGMT                             active
Validates that the L2 substrate under the SVIs is real. An SVI configured for a VLAN that does not appear here will never come up — creating the SVI does not create the VLAN. Confirm each access port shows up under the VLAN you intended; a user port stranded in VLAN 1 is invisible to every gateway you built.
show interfaces trunk — are the trunks carrying the right VLANs?
dc1-distr-c9300-01# show interfaces trunk
Port        Mode             Encapsulation  Status        Native vlan
Po1         on               802.1q         trunking      1

Port        Vlans allowed on trunk
Po1         10,20,30,99

Port        Vlans in spanning tree forwarding state and not pruned
Po1         10,20,30,99
Read all three stanzas, not just the first. A VLAN missing from allowed was pruned by switchport trunk allowed vlan on one side; a VLAN allowed but missing from the forwarding stanza is blocked by spanning tree or not active. Traffic for that VLAN silently dies on this link either way. Native VLAN must match both ends — a mismatch shows up here and as CDP error messages.
show arp — is the switch resolving hosts across VLANs?
dc1-distr-c9300-01# show arp | include Vlan
Internet  10.10.10.1             -   7035.0958.41c1  ARPA   Vlan10
Internet  10.10.10.50            4   a4bb.6dc2.118a  ARPA   Vlan10
Internet  10.10.20.1             -   7035.0958.41c2  ARPA   Vlan20
Internet  10.10.20.80           12   0050.56b3.9f04  ARPA   Vlan20
Validates the last hop. The dash-age entries are the SVIs themselves; the aged entries are live hosts the switch has resolved. If a host you are troubleshooting never appears here while you ping it from the switch, the problem is below Layer 3 — wrong access VLAN, cable, or host firewall — not routing.
show cdp neighbors — is the physical topology what the diagram says?
dc1-distr-c9300-01# show cdp neighbors
Device ID        Local Intrfce     Holdtme    Capability  Platform  Port ID
dc1-core-c9500-01.corp.example.com
                 Ten 1/1/1         154        R S I       C9500-24Y4C Ten 1/0/3
dc1-core-c9500-02.corp.example.com
                 Ten 1/1/2         141        R S I       C9500-24Y4C Ten 1/0/3
Validates cabling against intent before you trust any of the layers above it. Wrong Port ID against your documentation means the uplinks are swapped or the patch panel lies — find out now, not during the failover test. CDP is also the fastest detector of native VLAN mismatch: the switch logs %CDP-4-NATIVE_VLAN_MISMATCH within a minute of the misconfiguration.
Document everything in your IPAM/CMDB: device name, model, serial, IOS-XE version, Smart Licensing status, rack location, uplinks, purchase date, SMARTnet expiration. Set up automated config backups via Oxidized or RANCID from day one.
Troubleshooting inter-VLAN routing: nine failure modes
Ninety percent of “the Layer 3 switch is broken” tickets resolve to one of the nine patterns below. Work them in order — they are sequenced from the physical layer upward, the same layer-isolation discipline that applies to any network incident.
1. SVI stuck down/down
Symptoms: show ip interface brief shows the SVI down/down; hosts in the VLAN cannot ping their gateway.
Cause: Autostate. An SVI comes up only when its VLAN exists in the VLAN database and at least one physical port in that VLAN (access or trunk-allowed) is up and forwarding.
Resolution: Confirm the VLAN exists in show vlan brief; confirm a live port is assigned to it. On a bench switch with nothing connected, plug any port into the VLAN or test from a port-channel that allows it. Do not reach for the no autostate workaround in production — it masks real topology failures.
2. SVI administratively down
Symptoms: Status column reads administratively down.
Cause: The interface was never no shutdown-ed, or someone shut it during a change and the rollback missed it.
Resolution: interface Vlan20 → no shutdown. Then check the change log for why it was down — an SVI deliberately shut during an incident should not be silently revived.
3. IP routing not enabled
Symptoms: Every host pings its own gateway; nothing pings across VLANs. SVIs are all up/up. The switch itself can ping everything.
Cause: ip routing is missing — several Catalyst platforms ship with it disabled, and a write erase resets it. Without it the switch is a multi-gateway host, not a router.
Resolution: show running-config | include ip routing — if absent, configure ip routing in global config. Routing starts immediately; no reload.
4. Trunk not carrying the VLAN
Symptoms: Hosts on the local switch reach the gateway fine; hosts on a downstream access switch in the same VLAN cannot.
Cause: switchport trunk allowed vlan on one side omits the VLAN — classically, someone added VLAN 30 to the gateway switch and forgot the trunk statement, or used allowed vlan 30 (replace) instead of allowed vlan add 30 and wiped the list.
Resolution: show interfaces trunk on both ends; reconcile allowed lists. The add keyword is not optional knowledge — omitting it on a production trunk is a resume-generating event.
5. Native VLAN mismatch
Symptoms: Intermittent weirdness on a trunk: one VLAN leaks into another, STP errors, repeated %CDP-4-NATIVE_VLAN_MISMATCH log entries.
Cause: The untagged (native) VLAN differs across the two ends of an 802.1Q trunk, so untagged frames change VLANs in transit.
Resolution: Set it explicitly and identically on both ends — switchport trunk native vlan 99 — ideally to a dedicated unused VLAN, never VLAN 1 carrying user traffic.
6. Missing or wrong default route
Symptoms: All inter-VLAN traffic works; nothing reaches the Internet or remote sites. show ip route reads Gateway of last resort is not set.
Cause: The static default was never configured, points at the wrong next hop, or the OSPF default originate from the core stopped (check whether the core lost its upstream).
Resolution: Static design: ip route 0.0.0.0 0.0.0.0 <edge-router-ip> and confirm the edge router has return routes for your internal subnets — one-way reachability looks identical from the user side. OSPF design: chase the default back to whichever router should be originating it.
7. Host gateway misconfiguration
Symptoms: One host (or one DHCP scope worth of hosts) cannot leave its subnet; neighbors on the same VLAN are fine. The switch shows the host in show arp.
Cause: Host default gateway points at the wrong IP — stale static config, or a DHCP scope whose router option still hands out the old gateway after a migration. With HSRP, hosts configured with a physical SVI address instead of the virtual IP break on failover.
Resolution: Fix the DHCP scope option 3 (router) to the SVI — or HSRP virtual — address, and hunt down statically configured hosts. This is the failure mode that makes gateway migrations a change-control item, not a quick edit.
8. ACL silently dropping traffic
Symptoms: Some inter-VLAN flows work, others fail consistently by source, destination, or port. Pings may work while the application fails.
Cause: An ACL applied to an SVI (ip access-group ... in/out) is matching more than intended — usually an implicit deny doing exactly its job after someone appended a permit in the wrong order.
Resolution: show ip interface Vlan20 | include access list to find what is applied, then show access-lists and read the hit counters — the line with the climbing matches during a test is your culprit. Resequence rather than rewrite, and log-tag denies during the diagnostic window.
9. Duplicate IP address
Symptoms: Intermittent connectivity for one address that comes and goes with no config changes; %IP-4-DUPADDR in the log; ARP table flapping between two MAC addresses for the same IP.
Cause: A statically addressed device collides with the DHCP range, or worse, something is squatting on the SVI/HSRP address itself.
Resolution: show arp | include <ip> repeatedly to capture both MACs, trace each via show mac address-table address <mac> to a physical port, and remove the offender. Then fix the process gap: documented static ranges outside DHCP scopes — IPAM, not tribal memory.
Of the nine failure modes above, two dominate the after-hours calls we take: trunk allowed-lists that lost a VLAN during a change (mode 4 — almost always the missing add keyword), and DHCP scopes still handing out a decommissioned gateway after a migration (mode 7). Neither is visible from the switch that gets blamed. The estates that page us least have two things in common: explicit allowed-VLAN lists reviewed in change control, and automated config backups that make every change diffable the next morning.
Common day-one mistakes specific to Cisco IOS-XE
- Skipping Smart Licensing registration. Day 91 brings throttling. Configure CSSM transport on day 1.
- Leaving PnP enabled on a non-DNA shop. Every reboot hangs 10 min on PnP discovery.
- Forgetting
crypto key generate rsabefore SSH. No keys = silent SSH failures. - Mixing IOS-XE versions in a stack. Members go offline mid-day.
- TACACS without
localfallback. TACACS goes down → driving to the data center. - Forgetting
vrf-alsoon VTY access-class. Mgmt-vrf bypasses the ACL entirely. - Default-allowing all VLANs on trunk ports. Every broadcast crosses every link.
- Skipping
passive-interface defaulton OSPF. Hello packets leak to user SVIs. - No automated config backup. Switch dies, six hours rebuilding from memory.
Production design notes: spanning tree, redundancy, and monitoring
A Layer 3 boundary does not abolish Layer 2 — every VLAN below your SVIs is still a spanning-tree domain, and the interaction is where redundant designs quietly go wrong. Three rules from production:
Align STP root with the HSRP active router. Run spanning-tree mode rapid-pvst, hard-set root priority on the HSRP active switch (spanning-tree vlan 10,20,30 priority 4096, secondary 8192 on the standby). If root and active gateway diverge, inter-VLAN traffic takes an extra L2 hop across the inter-switch trunk for no reason — invisible until that trunk congests. Edge ports get portfast plus bpduguard; loops arrive via the cheap desktop switch someone smuggles under a desk, not via your engineered links.
Prefer routed redundancy to switched redundancy where you can. Distribution-to-core links built as routed point-to-points (the no switchport + /30 or /31 pattern) with OSPF + BFD converge in milliseconds and remove STP from the equation entirely; redundant L2 trunks with HSRP converge in seconds and keep STP in play. Where L2 adjacency must span switches — or the uplink needs raw capacity — bundle with LACP EtherChannel as covered in the hardening and LACP section: one logical link, no blocked redundant port, hitless single-member failure.
Instrument before the first incident. The remote syslog and SNMPv3 baseline from the hardening section is the floor. Add Flexible NetFlow on the Catalyst 9000 (flow monitor applied to the SVIs) so east-west traffic between VLANs is visible — when the server VLAN saturates, NetFlow tells you which conversation did it; interface counters only tell you that it happened. IP SLA probes between SVIs and toward the default gateway give you continuous data-plane truth that survives the “it was slow earlier” ticket. This telemetry layer is exactly what infrastructure performance monitoring consumes.
Layer 3 switch best practices
The configurations above keep a switch running; these conventions keep an estate maintainable for the five-to-ten years the hardware will actually serve:
- Make VLAN IDs encode the subnet. VLAN 10 ↔
10.x.10.0/24, VLAN 20 ↔10.x.20.0/24, consistently across every site. Every engineer who touches the network after you will either bless or curse this decision. - Name everything for the 2 a.m. engineer. Hostname encodes site/role/platform/unit (
dc1-distr-c9300-01); every interface gets adescriptionstating far end and circuit.show cdp neighborsshould confirm documentation, never substitute for it. - Document in systems, not spreadsheets. IPAM (NetBox or equivalent) is the source of truth for subnets, VLANs, and assignments; the CMDB carries serials, code versions, and support status — the same records that drive lifecycle planning decisions later.
- Summarize at boundaries. Each distribution pair advertises one summary upstream (
area rangein OSPF) instead of leaking every /24 into the core. Smaller tables, faster convergence, and a misbehaving access subnet cannot churn the campus. - Segment by policy, not convenience. Users, servers, voice, management, and IoT in separate VLANs with deliberate inter-VLAN ACLs at the SVI — the Layer 3 switch is your first east-west enforcement point, well before the firewall sees anything.
- Change-control the gateway layer. Every SVI, HSRP, trunk, and routing change rides a window with a written rollback — a gateway typo takes out a floor, not a desk. This is the discipline the change-control engagement above exists to enforce.
- Back up configurations automatically. Oxidized or RANCID from day one (see References), diff alerts on, restore actually tested. A dead switch with current backups is an RMA; without them it is a rebuild from memory at 2 a.m.
Lifecycle — SMARTnet and what comes after
A Catalyst 9300 goes through four commercial stages: Active production with SMARTnet → End of Sale (EoS) → End of Software Maintenance (EoSWM) → End of Support (EoSL).
The Catalyst 9300 first shipped in 2017. Models from the original launch are entering EoS / EoSWM in 2026-2028. Hardware itself is mechanically reliable for another 5-7 years past these dates — the constraint is vendor support, not hardware failure.
For organizations running Catalyst hardware past Cisco’s EoSL, post-SMARTnet Cisco maintenance provides TAC-equivalent engineering support, spare parts inventory, and SLA-backed response without forcing a hardware refresh. Cisco hardware lifecycle planning helps decide which switches to refresh, which to maintain, and which to consolidate. See also multi-vendor consolidation for organizations standardizing across Cisco, Juniper, HPE, and other platforms.
When to call WUC
This guide covers routine Catalyst 9000 deployment. Escalate to WUC if any of the following apply:
- The switch is going into a regulated environment (PCI-DSS, HIPAA, SOX, FedRAMP, CJIS) and the change is outside your existing change-control window.
- You’re refreshing from an older platform (3850 / 3650 / 4500-X) and need parallel-path migration with rollback windows defined for each phase.
- The deployment is part of a multi-site rollout where configuration consistency across 10+ switches matters.
- You inherited an existing Catalyst estate with no documentation and need a baseline audit of every switch.
- Your Catalyst hardware is past Cisco’s End-of-Software-Support and you need TAC-equivalent engineering coverage.
- You’re consolidating from multiple OEM contracts (Cisco + Juniper + HPE) into a single multi-vendor support engagement.
WUC engineers run multi-OEM enterprise infrastructure — Cisco Catalyst and Nexus, Juniper EX, HPE Aruba, plus the storage and server platforms most enterprise networks touch — under tiered SLAs with peer-reviewed change documentation. See Network Maintenance and Multi-Vendor Consolidation for engagement models.
Frequently asked questions
What is the difference between a Layer 3 switch and a router?
A Layer 3 switch routes IP traffic in forwarding ASICs at wire speed across high-density Ethernet ports, but offers little or no NAT, stateful inspection, or WAN connectivity. A router forwards in a more flexible (usually software-driven) path with full WAN, NAT, VPN, and large-table BGP support at far lower throughput per dollar. Inside the LAN, the switch wins; at the edge, the router does.
Can a Layer 3 switch replace a router?
For inter-VLAN routing and campus interior routing — yes, completely, and it will do the job faster. For Internet edge, WAN circuits, NAT, or site-to-site VPN termination — no. The standard enterprise pattern is Layer 3 switches for everything inside the building and a router or SD-WAN appliance facing the carrier.
How do I enable routing on a Cisco switch?
Three steps: enable the global routing process with ip routing (plus ipv6 unicast-routing if applicable), create an SVI per VLAN with interface Vlan10 and an IP address, and give the switch a way out — either a static default route or a routing protocol such as OSPF. Hosts then use each SVI address as their default gateway. The full procedure with verification is the body of this guide.
What is an SVI?
A switch virtual interface (SVI) is a logical Layer 3 interface bound to a VLAN. Its IP address acts as the default gateway for every host in that VLAN, and the switch routes between SVIs in hardware. One SVI per routed VLAN; an SVI only comes up when its VLAN exists and has at least one active port.
Do Layer 3 switches support dynamic routing protocols?
Yes. Catalyst 9000 switches run static routing, OSPF, EIGRP, IS-IS, and BGP; exact support depends on the license tier (Network Essentials vs Network Advantage). OSPF with BFD is the common campus choice. They are not designed to carry full Internet BGP tables — TCAM is sized for enterprise route counts, not the global table.
When should I use a router instead of a Layer 3 switch?
When the requirement involves WAN or Internet handoffs, NAT/PAT at scale, stateful or per-flow services, encrypted tunnels in volume, QoS shaping onto slow circuits, or full BGP tables. If the traffic leaves your building or needs per-session intelligence, route it through a router or firewall; if it stays on your Ethernet, keep it on the switch ASIC.
Final word: a Cisco Layer 3 switch setup that holds up
A production-grade Cisco Layer 3 switch setup is not the twenty minutes of SVI commands — it is the decisions around them: PnP disabled deliberately, Smart Licensing registered on day one, management isolated in its own VRF, inter-VLAN routing verified with the six commands above rather than assumed, gateways made redundant, and the whole thing documented and backed up before the first user ever touches it. Work the guide top to bottom and the switch you rack this week will still be boringly reliable when its refresh conversation comes up years from now. And when the deployment is bigger than one switch — or the change window carries compliance weight — that is what WUC network engineering is for.
References
- Cisco Systems. Recommended Releases for Catalyst 9200/9300/9400/9500/9600 Platforms. TAC suggested-release tracking.
- Cisco Systems. Smart Licensing Using Policy. Consolidated licensing guide, Cisco Catalyst 9000 Series switches.
- Cisco Systems. Cisco IOS XE Software Hardening Guide. Device-hardening reference.
- Baker, F. RFC 1812 — Requirements for IP Version 4 Routers. IETF.
- Nadas, S. RFC 5798 — Virtual Router Redundancy Protocol (VRRP) Version 3. IETF.
- NIST. SP 800-53 Rev. 5 — Security and Privacy Controls for Information Systems and Organizations.
- Oxidized project. Oxidized — network device configuration backup. GitHub.
Find our field guides faster in Google. Add WUC Technologies as a preferred source and our engineering guides carry a “preferred” badge in your Search results, AI Overviews, and AI Mode.
Engineering Tools
Interactive client-side utilities for routine storage and networking work. Built by WUC engineers from the same change-control patterns we use on customer fabrics.
Every tool runs entirely in your browser. No WWPNs, IP addresses, hostnames, or configuration values are transmitted anywhere. No analytics on input values. No external network calls after the page loads.
MDS Zone Command Generator
Generate ready-to-paste Cisco MDS zoning commands for dual-fabric SAN setups. Supply HBA + target WWPNs, VSAN IDs, and zoneset names — the tool produces commands for both fabrics with SIST or multi-target compact layout. Built-in show zone pending-diff safety reminder, one-click copy / download.
Tools currently in development
We own change windows for production fabrics
Peer-reviewed CLI scripts, pre-change validation, real-time path monitoring, rollback rehearsed in lab. The tool gives you the commands; we can run them safely under contract.
Engineering Field Guides
CLI-level operational reference material for production storage, networking, and infrastructure work. Written by WUC engineers from real engagement experience — not vendor marketing.
Each guide covers a specific operational procedure: change-control framing, command sequences with annotations, single-initiator best-practice notes, verification steps across Linux / Windows / ESXi where applicable, and an explicit “when to escalate to WUC” boundary.
Cisco MDS Zoning: A Field Guide for NetApp AFF Dual-Fabric Setups
CLI reference for creating zones, decommissioning hosts, and swapping HBA WWPNs during hardware replacement on Cisco MDS switches paired with NetApp AFF storage. Covers SIST best practice, show zone pending-diff safety gates, and host-side path verification on Linux, Windows, and ESXi.
Field guides currently in draft
WUC engineers run production fabrics for a living
If you’re mid-incident or pre-cutover and need a peer-reviewed CLI script with rollback rehearsed in lab — we own the change window for you. Multi-OEM, tiered SLAs, SOC 2 audit-ready operations.